
Articles
- Page Path
- HOME > Epidemiol Health > Volume 41; 2019 > Article
-
Original Article
Distribution and social determinants of overweight and obesity: a cross-sectional study of non-pregnant adult women from the Malawi Demographic and Health Survey (2015-2016) -
Leonard Mndala1,2
 , Abhay Kudale2
 -
Epidemiol Health 2019;41:e2019039.
DOI: https://doi.org/10.4178/epih.e2019039
Published online: September 27, 2019
1Complete Health Foundation, Lilongwe, Malawi
2Interdisciplinary School of Health Sciences, Savitribai Phule Pune University, Pune, India
- Correspondence: Leonard Mndala Complete Health Foundation, P.O. Box 3206, Lilongwe, Malawi E-mail: leonardmndala@gmail.com
©2019, Korean Society of Epidemiology
This is an open-access article distributed under the terms of the Creative Commons Attribution License (http://creativecommons.org/licenses/by/4.0/), which permits unrestricted use, distribution, and reproduction in any medium, provided the original work is properly cited.
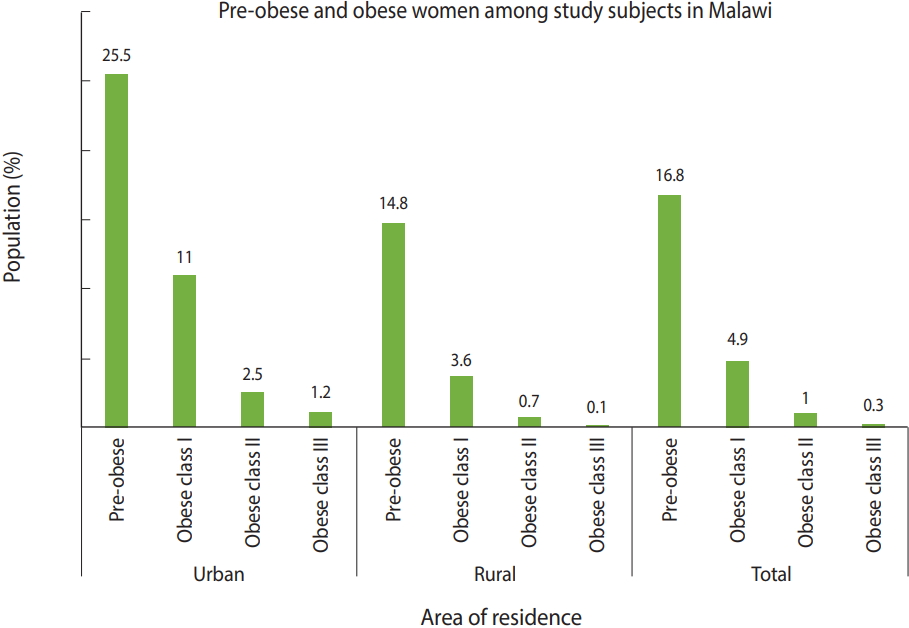
Figure & Data
References
Citations
- Level of overweight and obesity surpassed underweight among women in 40 low and middle-income countries: Findings from a multilevel multinomial analysis of population survey data
Kusse Urmale Mare, Kebede Gemeda Sabo, Beriso Furo Wengoro, Begetayinoral Kussia Lahole, Zacharie Tsala Dimbuene
PLOS ONE.2025; 20(3): e0320095. CrossRef - Overweight and obesity trends and associated factors among reproductive women in Ethiopia
Ermias Tadesse Beyene, Seungman Cha, Yan Jin
Global Health Action.2024;[Epub] CrossRef - Spatial clustering of overweight/obesity among women in India: Insights from the latest National Family Health Survey
Mahashweta Chakrabarty, Subhojit Let, Jay Saha
PLOS ONE.2024; 19(7): e0305205. CrossRef - Obesity and the Need for Bariatric Surgery in Nigeria: A Review
Adedire Timilehin Adenuga, Iliya Karniliyus Salu, Usman Mohammed Bello, Abuchi Okaro
Nigerian Postgraduate Medical Journal.2024; 31(3): 207. CrossRef - Exploring the Causes of Obesity Among Adults in the Kurdish Regions of Iran: A Qualitative Study
Seyed Fahim Irandoost, Bahman Bayangani, Tahereh Dehdari, Javad Yousefi Lebni, Nafe Babasfari, Nafiul Mehedi, Mohammad Hosein Taghdisi
Community Health Equity Research & Policy.2023; 43(2): 183. CrossRef - Updating the association between socioeconomic status and obesity in low‐income and lower‐middle‐income sub‐Saharan African countries: A literature review
Bertille Daran, Pierre Levasseur, Matthieu Clément
Obesity Reviews.2023;[Epub] CrossRef - Analysis of Correlation between the Socioeconomic Environment and Level of Nutrition in the Population of Serbia: A Part of the National Survey
Mladen Grujicic, Marija Sekulic, Milos Stepovic, Natasa Zdravkovic, Vladan Markovic, Jagoda Gavrilovic, Mirjana Veselinovic, Jelena Vuckovic-Filipovic, Katarina Nikolic, Olivera Milovanovic, Branimir Radmanovic, Bojan Milosevic, Rada Vucic, Stefan Jakovlj
Sustainability.2023; 15(14): 11189. CrossRef - Individual and contextual predictors of overweight or obesity among women in Uganda: a spatio-temporal perspective
Prince M. Amegbor, Ortis Yankey, Megan Davies, Clive E. Sabel
GeoJournal.2022; 87(5): 3793. CrossRef - Then and Now: Investigating Anthropometrics and Child Mortality among Females in Malawi
Sally Sonia Simmons, John Elvis Hagan, Thomas Schack
International Journal of Environmental Research and Public Health.2022; 19(10): 6171. CrossRef - Maternal overweight and obesity and its associated factors and outcomes in human immunodeficiency virus (HIV)‐infected and HIV‐uninfected black South African pregnant women
Christen R. Erasmus, Anil A. Chuturgoon, Niren R. Maharaj
Journal of Obstetrics and Gynaecology Research.2022; 48(11): 2697. CrossRef - Country-Level Variations in Overweight and Obesity among Reproductive-Aged Women in Sub-Saharan Countries
Olah Owobi, Osaretin Okonji, Chimezie Nzoputam, Michael Ekholuenetale
Women.2022; 2(4): 313. CrossRef - Food purchasing decisions of Malawian mothers with young children in households experiencing the nutrition transition
Valerie L. Flax, Chrissie Thakwalakwa, Courtney H. Schnefke, John C. Phuka, Lindsay M. Jaacks
Appetite.2021; 156: 104855. CrossRef - Time trends in socio-economic, urban-rural and regional disparities in prevalence of obesity among non-pregnant women in Lesotho: evidence from Lesotho demographic and health surveys (2004–2014)
Betregiorgis Zegeye, Gebretsadik Shibre, Gashaw Garedew Woldeamanuel
BMC Public Health.2021;[Epub] CrossRef - Risk factors for overweight and obesity among women of reproductive age in Dar es Salaam, Tanzania
Dominic Mosha, Heavenlight A. Paulo, Mary Mwanyika-Sando, Innocent B. Mboya, Isabel Madzorera, Germana H. Leyna, Sia E. Msuya, Till W. Bärnighausen, Japhet Killewo, Wafaie W. Fawzi
BMC Nutrition.2021;[Epub] CrossRef - Observed magnitude and trends in socioeconomic and geographic area inequalities in obesity prevalence among non-pregnant women in Chad: evidence from three waves of Chad demographic and health surveys
Gebretsadik Shibre, Betregiorgis Zegeye, Gashaw Garedew Woldeamanuiel, Wassie Negash, Gorems Lemma, Mitku Mamo Taderegew
Archives of Public Health.2021;[Epub] CrossRef - Education and prevalence of overweight and obesity among reproductive age group women in Ethiopia: analysis of the 2016 Ethiopian demographic and health survey data
Ayelign Mengesha Kassie, Biruk Beletew Abate, Mesfin Wudu Kassaw
BMC Public Health.2020;[Epub] CrossRef - Drivers of food consumption among overweight mother-child dyads in Malawi
Chrissie Thakwalakwa, Valerie L. Flax, John C. Phuka, Harrison Garcia, Lindsay M. Jaacks, Mauro Lombardo
PLOS ONE.2020; 15(12): e0243721. CrossRef
 PubReader
 ePub Link
 Cite
Cite
Figure 1.
| Characteristics | n (%) |
|---|---|
| Age (yr) | |
| 18-22 | 1,530 (23.7) |
| 23-27 | 1,316 (20.5) |
| 28-32 | 1,179 (18.4) |
| 33-37 | 969 (15.0) |
| 38-42 | 711 (10.9) |
| ≥43 | 738 (11.5) |
| Region | |
| Northern | 1,230 (11.3) |
| Central | 2,201 (42.5) |
| Southern | 3,012 (46.2) |
| Residence | |
| Urban | 1,401 (18.5) |
| Rural | 5,042 (81.5) |
| Marital status | |
| Never in union/single | 783 (11.6) |
| Married | 4,318 (68.0) |
| Living with partner | 324 (4.7) |
| Widowed | 239 (3.5) |
| Divorced | 380 (6.1) |
| Separated | 399 (6.0) |
| Education | |
| None | 856 (13.8) |
| Primary | 3,726 (59.0) |
| Secondary | 1,655 (23.6) |
| Higher | 206 (3.6) |
| Religion | |
| Catholic | 1,110 (17.5) |
| Protestant | 1,817 (26.4) |
| Other Christian | 2,766 (42.9) |
| Muslim | 722 (12.6) |
| None | 28 (0.5) |
| Ethnicity | |
| Chewa | 1,922 (34.1) |
| Tumbuka | 658 (8.9) |
| Lhomwe | 1,197 (19.8) |
| Yao | 747 (13.7) |
| Ngoni | 813 (11.8) |
| Others | 1,106 (11.8) |
| Occupation | |
| Professional/technician/managerial | 392 (5.5) |
| Clerical/sales | 408 (6.2) |
| Agriculture (self/employee) | 2,574 (41.3) |
| Household and domestic | 92 (1.8) |
| Services | 70 (1.4) |
| Skilled manual | 113 (1.7) |
| Unskilled manual | 911 (14.1) |
| Not working | 1,883 (28.1) |
| Parity in previous 5 yr | |
| No | 2,395 (36.7) |
| 1 | 2,887 (45.1) |
| ≥2 | 1,161 (18.2) |
| Covered by health insurance | |
| No | 6,343 (98.3) |
| Yes | 100 (1.7) |
| Contraceptive use (of any form) | |
| Not using | 2,861 (44.2) |
| Using | 3,528 (55.8) |
| Self-reported menopause status | |
| Not in menopause | 6,262 (97.2) |
| In menopause | 181 (2.8) |
| Current smoking status | |
| Does not smoke | 6,392 (99.3) |
| Smokes | 51 (0.7) |
| Who makes decision concerning respondent’s health care | |
| Others | 5 (0.1) |
| Respondent alone | 890 (18.9) |
| Respondent and husband/partner | 2,375 (50.5) |
| Husband/partner alone | 1,351 (30.1) |
| Someone else | 21 (0.4) |
| SES quintiles | |
| First (poorest) | 1,097 (19.3) |
| Second | 1,195 (19.1) |
| Third | 1,186 (18.8) |
| Fourth | 1,282 (19.2) |
| Fifth (richest) | 1,683 (23.6) |
| Areas | Age (yr) | Weight (kg) | Height (m) | BMI (kg/m2) |
|---|---|---|---|---|
| Urban | 29.00±7.80 | 61.43±13.01 | 1.57±0.06 | 24.80±4.91 |
| Rural | 30.00±8.70 | 55.12±9.35 | 1.56±0.06 | 22.66±3.60 |
| Residence combined | 30.22±8.60 | 56.31±10.40 | 1.56±0.06 | 23.06±3.94 |
| BMI (kg/m2) |
|||||
|---|---|---|---|---|---|
| <18.50 (underweight) | 18.50-24.99 (normal weight) | 25.00-29.99 (overweight) | ≥30.00 (obese) | p-value |
|
| Age (yr) | <0.001 | ||||
| 18-22 | 6.3 | 82.2 | 10.6 | 0.9 | |
| 23-27 | 4.7 | 76.8 | 13.8 | 4.7 | |
| 28-32 | 5.7 | 65.0 | 21.6 | 7.7 | |
| 33-37 | 5.6 | 61.3 | 21.4 | 11.6 | |
| 38-42 | 6.2 | 67.2 | 19.0 | 7.6 | |
| ≥43 | 5.8 | 65.3 | 19.0 | 9.9 | |
| Region | 0.056 | ||||
| Northern | 5.3 | 67.9 | 20.3 | 6.5 | |
| Central | 5.4 | 72.0 | 15.8 | 6.8 | |
| Southern | 6.1 | 71.3 | 16.8 | 5.8 | |
| Residence | <0.001 | ||||
| Urban | 5.2 | 54.7 | 25.5 | 14.6 | |
| Rural | 5.8 | 75.0 | 14.8 | 4.4 | |
| p-value |
0.046 | <0.001 | <0.001 | ||
| Marital status | <0.001 | ||||
| Never in union | 7.8 | 73.9 | 15.4 | 3.0 | |
| Married | 5.2 | 70.6 | 16.9 | 7.4 | |
| Living with partner | 4.3 | 76.2 | 17.2 | 2.3 | |
| Widowed | 6.3 | 64.4 | 20.7 | 8.6 | |
| Divorced | 7.7 | 68.3 | 19.6 | 4.4 | |
| Separated | 6.3 | 76.6 | 13 | 4.2 | |
| Education | <0.001 | ||||
| None | 6.5 | 70.1 | 18.3 | 5.1 | |
| Primary | 5.5 | 75.0 | 14.6 | 4.8 | |
| Secondary | 6.2 | 64.7 | 19.9 | 9.2 | |
| Higher | 1.7 | 57.0 | 26.1 | 15.2 | |
| Religion | <0.001 | ||||
| None | 12.5 | 62.5 | 15.6 | 9.4 | |
| Catholic | 5.4 | 71.1 | 18.6 | 4.9 | |
| Protestant | 3.9 | 69.8 | 19.4 | 6.9 | |
| Other Christian | 6.4 | 71.9 | 15.3 | 6.4 | |
| Muslim | 7.2 | 72.5 | 13.8 | 6.6 | |
| Ethnicity | <0.001 | ||||
| Others | 5.2 | 69.5 | 17.3 | 8.1 | |
| Chewa | 5.6 | 74.4 | 15.1 | 4.8 | |
| Tumbuka | 4.2 | 68.4 | 20.3 | 7.1 | |
| Lhomwe | 6.3 | 72.0 | 15.9 | 5.7 | |
| Yao | 6.1 | 71.1 | 14.9 | 7.9 | |
| Ngoni | 5.8 | 64.6 | 22.1 | 7.4 | |
| Occupation | <0.001 | ||||
| Not working | 5.9 | 71.0 | 17.7 | 5.5 | |
| Professional/mana- gerial/technician | 3.7 | 53.3 | 27.2 | 15.9 | |
| Clerical/sales | 4.3 | 63.5 | 20.5 | 11.6 | |
| Agriculture (self/ employee) | 5.7 | 78 | 12.9 | 3.4 | |
| Household and domestic | 0.9 | 65.5 | 26.5 | 7.1 | |
| Services | 8.0 | 55.7 | 29.5 | 6.8 | |
| Skilled manual | 3.7 | 57.0 | 27.1 | 12.1 | |
| Unskilled manual | 7.2 | 66.1 | 17.0 | 9.6 | |
| SES quintile | <0.001 | ||||
| First (poorest) | 7.1 | 80.1 | 10.9 | 1.9 | |
| Second | 5.2 | 80.8 | 10.8 | 3.3 | |
| Third | 5.2 | 75.7 | 15.5 | 3.6 | |
| Fourth | 6.2 | 68.7 | 18.8 | 6.3 | |
| Fifth (richest) | 4.9 | 54.7 | 25.8 | 14.6 | |
| SES quintiles | Body mass index (kg/m2) |
||||
|---|---|---|---|---|---|
| Pre-obese (25.00-29.99) | Obese class I (30.00-34.99) | Obese class II (35.00-39.99) | Obese class III (≥40.00) | p-value |
|
| First (poorest) | 106 (10.9) | 13 (1.3) | 5 (0.5) | - | <0.001 |
| Second | 136 (10.8) | 30 (3.0) | 3 (0.2) | 1 (0.1) | |
| Third | 186 (15.5) | 32 (2.7) | 11 (0.8) | - | |
| Fourth | 255 (18.8) | 62 (5.0) | 11 (0.9) | 6 (0.4) | |
| Fifth (richest) | 439 (25.8) | 201 (11.3) | 39 (2.4) | 21 (0.9) | |
| Total | 1,122 (16.8) | 338 (4.9) | 69 (1.0) | 28 (0.3) | |
| Variables | Crude OR (95% CI) | Adjusted OR (95% CI) |
|---|---|---|
| Age (yr) | ||
| 18-22 | 1.00 (reference) | 1.00 (reference) |
| 23-27 | 1.74 (1.41, 2.14) | 1.53 (1.14, 2.06) |
| 28-32 | 3.17 (2.59, 3.88) | 3.06 (2.28, 4.10) |
| 33-37 | 3.77 (3.06, 4.63) | 3.95 (2.91, 5.36) |
| 38-42 | 2.76 (2.20, 3.48) | 3.02 (2.15, 4.24) |
| ≥43 | 3.10 (2.48, 3.88) | 3.26 (2.29, 4.64) |
| Region | ||
| Northern | 1.00 (reference) | 1.00 (reference) |
| Central | 0.80 (0.66, 0.97) | 0.89 (0.65, 1.21) |
| Southern | 0.79 (0.66, 0.97) | 0.82 (0.60, 1.12) |
| Residence | ||
| Rural | 1.00 (reference) | 1.00 (reference) |
| Urban | 2.82 (2.47, 3.23) | 1.18 (0.93, 1.49) |
| Marital Status | ||
| Never in union/single | 1.00 (reference) | 1.00 (reference) |
| Married | 1.43 (1.17, 1.74) | 0.93 (0.68, 1.27) |
| Living with partner | 1.07 (0.76, 1.50) | - |
| Widowed | 1.86 (1.32, 2.63) | - |
| Divorced | 1.42 (1.05, 1.91) | - |
| Separated | 0.94 (0.68, 1.29) | - |
| Education | ||
| None | 1.00 (reference) | 1.00 (reference) |
| Primary | 0.79 (0.66, 0.94) | 0.77 (0.62, 0.96) |
| Secondary | 1.34 (1.11, 1.63) | 0.91 (0.68, 1.21) |
| Higher | 2.30 (1.69, 3.11) | 0.97 (0.58, 1.64) |
| Religion | ||
| None | 1.00 (reference) | 1.00 (reference) |
| Other Christian | 0.79 (0.36, 1.75) | 0.84 (0.32, 2.17) |
| Muslim | 0.72 (0.32, 1.64) | 0.81 (0.30, 2.21) |
| Catholic | 0.87 (0.39, 1.95) | 0.81 (0.31, 2.13) |
| Protestant | 1.02 (0.46, 2.26) | 0.97 (0.37, 2.55) |
| Ethnicity | ||
| Others | 1.00 (reference) | 1.00 (reference) |
| Tumbuka | 1.11 (0.87, 1.43) | 0.99 (0.69, 1.40) |
| Lhomwe | 0.81 (0.66, 1.01) | 1.10 (0.83, 1.47) |
| Yao | 0.87 (0.69, 1.09) | 1.37 (0.95, 1.98) |
| Ngoni | 1.24 (0.99, 1.56) | 1.54 (1.14, 2.08) |
| Chewa | 0.73 (0.60, 0.89) | 1.08 (0.81, 1.44) |
| Occupation | ||
| Not working | 1.00 (reference) | 1.00 (reference) |
| Professional/technician/managerial | 2.49 (1.97, 3.16) | 0.99 (0.71, 1.39) |
| Clerical/sales | 1.56 (1.23, 1.99) | 1.01 (0.74, 1.37) |
| Agriculture (self/employee) | 0.65 (0.56, 0.75) | 0.69 (0.57, 0.84) |
| Household and domestic | 1.68 (1.12, 2.52) | 1.28 (0.63, 2.60) |
| Services | 1.85 (1.18, 2.90) | 1.22 (0.64, 2.34) |
| Skilled manual | 2.10 (1.40, 3.15) | 1.59 (0.96, 2.64) |
| Unskilled manual | 1.21 (1.00, 1.45) | 1.07 (0.85, 1.36) |
| Parity in previous 5 yr | ||
| No | 1.00 (reference) | 1.00 (reference) |
| 1 | 0.73 (0.64, 0.83) | 0.95 (0.79, 1.15) |
| ≥2 | 0.47 (0.39, 0.56) | 0.72 (0.56, 0.93) |
| Covered by health insurance | ||
| No | 1.00 (reference) | 1.00 (reference) |
| Yes | 2.48 (1.68, 3.65) | 1.28 (0.71, 2.29) |
| Contraceptive use (of any form) | ||
| No | 1.00 (reference) | 1.00 (reference) |
| Yes | 0.91 (0.81, 1.03) | 0.95 (0.81, 1.11) |
| Self-reported menopause status | ||
| Not in menopause | 1.00 (reference) | 1.00 (reference) |
| In menopause | 0.88 (0.61, 1.27) | 0.75 (0.48, 1.17) |
| Current smoking status | ||
| Not smoking | 1.00 (reference) | 1.00 (reference) |
| Smoking | 0.82 (0.39, 1.72) | 0.92 (0.41, 2.09) |
| Who makes decision concerning respondent’s health care | ||
| Others | 1.00 (reference) | 1.00 (reference) |
| Respondent alone | 0.62 (0.09, 3.99) | 0.33 (0.05, 2.33) |
| Respondent and husband/partner | 0.68 (0.11, 4.29) | 0.37 (0.05, 2.63) |
| Respondent and other person | 0.49 (0.08, 3.09) | 0.32 (0.05, 2.23) |
| Husband/partner alone | 0.77 (0.09, 6.32) | 0.63 (0.07, 5.98) |
| Total household members (n) | ||
| ≤3 | 1.00 (reference) | 1.00 (reference) |
| 4-7 | 1.03 (0.89, 1.19) | 0.82 (0.66, 1.02) |
| 8-10 | 1.23 (0.99, 1.51) | 1.09 (0.81, 1.46) |
| ≥11 | 1.12 (0.71, 1.77) | 0.91 (0.48, 1.71) |
| SES quintiles | ||
| First (poorest) | 1.00 (reference) | 1.00 (reference) |
| Second | 1.12 (0.89, 1.42) | 1.08 (0.82, 1.43) |
| Third | 1.61 (1.29, 2.01) | 1.31 (1.00, 1.71) |
| Fourth | 2.29 (1.85, 2.83) | 1.67 (1.28, 2.18) |
| Fifth (richest) | 4.64 (3.81,5.65) | 3.30 (2.46, 4.43) |
SES, socioeconomic status.
Values are presented as mean±standard deviation. BMI, body mass index.
Values are presented as %. BMI, body mass index; SES, socioeconomic status. Pearson chi-square test. Met the assumption for Bonferroni correction for within-column probabilities (alpha=0.006): multiple-wise analysis is limited, hence not inflating the ‘family’ (type I) error [
Values are presented as frequency number (%). Pearson chi-square test.
For the adjusted ORs, multivariate logistic regression was done, adjusting for all other covariates to address possible confounding; For crude ORs, univariate logistic regression was done. ORs, odd ratios; CI, confidence interval; SES, socioeconomic status.

