
Articles
- Page Path
- HOME > Epidemiol Health > Volume 42; 2020 > Article
-
Original Article
An alarmingly high and increasing prevalence of obesity in Jordan -
Kamel Ajlouni1
 , Yousef Khader2, Anwar Batieha2, Hashem Jaddou2, Mohammed El-Khateeb1
 -
Epidemiol Health 2020;42:e2020040.
DOI: https://doi.org/10.4178/epih.e2020040
Published online: June 6, 2020
1National Center for Diabetes, Endocrinology and Genetics, Jordan University, Amman, Jordan
2Department of Public Health, Jordan University of Science and Technology, Irbid, Jordan
- Correspondence: Yousef Khader Department of Public Health, Jordan University of Science and Technology, P.O. Box 3030, Irbid 22110, Jordan E-mail: yskhader@just.edu.jo
©2020, Korean Society of Epidemiology
This is an open-access article distributed under the terms of the Creative Commons Attribution License (http://creativecommons.org/licenses/by/4.0/), which permits unrestricted use, distribution, and reproduction in any medium, provided the original work is properly cited.
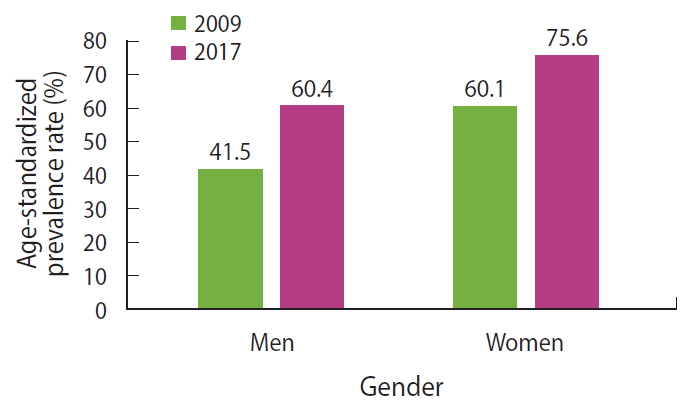
Figure & Data
References
Citations
- Prevalence of Being Obese, Overweight, and Underweight Among Jordanian Children and Adolescents Based on International Growth Standards
Walid Al-Qerem, Ruba Zumot, Anan Jarab, Judith Eberhardt, Fawaz Alasmari, Alaa Hammad
Healthcare.2025; 13(2): 146. CrossRef - Food consumption and adherence to dietary guidelines among Jordanian children and adolescents
Buthaina Alkhatib, Huda Al Hourani, Islam K. Al-Shami, Ayoub Al-Jawaldeh
F1000Research.2025; 12: 1094. CrossRef - Exploring socio-demographic determinants of obesity in Jordanian women of reproductive age: insights from a nationwide survey
Mahmoud Shaaban Abdelgalil, Sara Hosny El-Farargy, Mohamed Adel Dowidar, Mohamed Abd-ElGawad
BMC Public Health.2025;[Epub] CrossRef - Exploring fracture risk assessment tool (FRAX®) for women 50 years and older: A cross-sectional study
Lobna Gharaibeh, Mariam Alameri, Zainab Lafi, Rana K Abu-Farha, Aseel Yaghi, Navra Sahawneh, Nadia Alkateeb, Maryna Alfawair
Electronic Journal of General Medicine.2025; 22(2): em633. CrossRef - The Effect of Randomized Calcium Intervention Through Dairy Foods and Supplements on Body Weight and Fat Loss
Rula Ali Amr, Ala A. Qatatsheh, Rand T. Akasheh
Topics in Clinical Nutrition.2025; 40(2): 100. CrossRef - Clinical Characteristics and Treatment Outcomes of Colorectal Cancer in Jordan, a Resource-Restricted Country
Hikmat Abdel-Razeq, Maha Barbar, Sarah Abdel-Razeq, Fawzi Abuhijla, Issa Mohamad, Kamal Al-Rabi, Akram Al-Ibraheem, Hazem Hammad, Asem Mansour
JCO Global Oncology.2025;[Epub] CrossRef - Variations in ten-year cardiovascular disease risk and determinants in five countries
Yihun Mulugeta Alemu, Nasser Bagheri, Kinley Wangdi, Alice Richardson, Dan Chateau
Journal of Global Health Economics and Policy.2025;[Epub] CrossRef - Variations in ten-year cardiovascular disease risk and determinants in five countries
Yihun Mulugeta Alemu, Nasser Bagheri, Kinley Wangdi, Alice Richardson, Dan Chateau
Journal of Global Health Economics and Policy.2025;[Epub] CrossRef - Preoperative LMWH and Bleeding Outcomes Following Sleeve Gastrectomy: A Retrospective Cohort Study
Amr M. Bishtawi, Ghazal M. Abo Islaieh, Mahmoud T. Juneidi, MohammadNour T. Atieh, Farah A. Zaid-Alkilani, Lara K. Gammoh, Amanda M. Samawi, Zeenah H. Fraihat
Obesity Surgery.2025;[Epub] CrossRef - Are There Any Correlations between Vitamin D, Calcium, and Magnesium Intake and Coronary and Obesity Indices?
Buthaina Alkhatib, Lana M. Agraib, Anfal Al-Dalaeen, Islam Al-Shami
Journal of the American Nutrition Association.2024; 43(1): 12. CrossRef - Childhood Obesity: An Updated Review
Alexander K.C. Leung, Alex H.C. Wong, Kam Lun Hon
Current Pediatric Reviews.2024; 20(1): 2. CrossRef - Habitual food consumption, eating behavior and meal-timing among Jordanian adults with elevated Blood pressure: a cross-sectional population-based study
Buthaina Alkhatib, Islam Al-Shami, Lana M. Agraib
Blood Pressure.2024;[Epub] CrossRef - The Association of M235T Genetic Polymorphism in Angiotensinogen Gene and Other Non-Genetic Factors with Essential Hypertension among Jordanian Patients
Hussein Alhawari, Yazun Jarrar, Malek Zihlif, Ayman Wahbeh, Sameeha Alshelleh, Ruba Alhabahbeh, Dalia Abdelrazaq
Journal of Personalized Medicine.2024; 14(3): 273. CrossRef - The Novelty of using Obesity Indices as Blood Pressure Predictors
Buthaina Alkhatib, Lana M. Agraib, Islam Al-Shami, Anfal AL-Dalaeen
Current Hypertension Reviews.2024; 20(1): 36. CrossRef - Prevalence of obesity in Kirkuk governorate/Iraq
Karar Nadhum Jawad Musafer, Sarah Mohammed Alsheikh
International Journal of Recent Innovations in Medicine and Clinical Research.2024; 6(3): 85. CrossRef - The transformation of Jordan’s healthcare system in an area of conflict
Ahmad Tamimi, Mousa Al-Abbadi, Iskandar Tamimi, Malik Juweid, Muayyad Ahmad, Faleh Tamimi
BMC Health Services Research.2024;[Epub] CrossRef - Food consumption and adherence to dietary guidelines among Jordanian children and adolescents
Buthaina Alkhatib, Huda Al Hourani, Islam K. Al-Shami, Ayoub Al-Jawaldeh
F1000Research.2024; 12: 1094. CrossRef - Severe depression association with the addiction to fast food and smartphones in Jordanians: a cross-sectional study
Nawal AlSakarneh, Dana Kakeesh, Khaled Al-Marazeeq, Ali Ahmad Banysaed, Omar Gammoh
Discover Food.2024;[Epub] CrossRef - Evaluation of the blood lipid profile pattern in female breast cancer patients in Jordan.
Ali Alsarhan, Ali Ata Alsarhan, Ibrahim Al Odat, Alia Khwaldeh, Baker Al Shara
Nutrición Clínica y Dietética Hospitalaria.2024;[Epub] CrossRef - The Adverse Impact of Waterpipe Dependence on Emotions: The Obesity Factor
Mahmoud A. Alomari, Omar F. Khabour, Ali Ahmed Bani-Ahmed
Asian Journal of Social Health and Behavior.2024; 7(3): 103. CrossRef - Impact of COVID-19 pandemic on obesity among adults in Jordan
Taha Rababah, Muhammad Al-U'datt, Malak M. Angor, Sana Gammoh, Rana Rababah, Ghazi Magableh, Ali Almajwal, Yara AL-Rayyan, Numan AL-Rayyan
Frontiers in Nutrition.2023;[Epub] CrossRef - Profiling Cardiometabolic Health in Jordan: A Call to Action to Improve Cardiovascular Health
Khalid Sawalha, Reda Asad, Fuad Habash, Angel López-Candales
Cureus.2023;[Epub] CrossRef - Energy and macronutrient intakes in Jordan: a population study
Huda Al Hourani, Buthaina Alkhatib, Islam Al-Shami, Amin N. Olaimat, Murad Al-Holy, Narmeen Jamal Al-Awwad, Mahmoud Abughoush, Nada A. Saleh, Dima AlHalaika, Omar Alboqai, Ayoub Al-Jawaldeh
Scientific Reports.2023;[Epub] CrossRef - Progression to Obesity: Variations in Patterns of Metabolic Fluxes, Fat Accumulation, and Gastrointestinal Responses
Fadia Milhem, Slavko Komarnytsky
Metabolites.2023; 13(9): 1016. CrossRef - Strengthening Primary Healthcare in Jordan for Achieving Universal Health Coverage: A Need for Family Health Team Approach
Yousef Khader, Mohannad Al Nsour, Sara Abu Khudair, Randa Saad, Mohammad Rassoul Tarawneh, Faris Lami
Healthcare.2023; 11(22): 2993. CrossRef - Food consumption and adherence to dietary guidelines among Jordanian children and adolescents
Buthaina Alkhatib, Huda Al Hourani, Islam K. Al-Shami, Ayoub Al-Jawaldeh
F1000Research.2023; 12: 1094. CrossRef - Bariatric Surgery Impact on Pregnancy and Reproductive Outcomes: A Retrospective Cohort Study in Jordan
Nadia Muhaidat, Satani G Sharkas, Lara Al-Abdallat, Tala Dabit, Tala Basheer Hyasat, Omar Mustafa Odeh Odeh, Ahmad Imad Muhtaseb, Mohammad Rashdan
Clinical and Experimental Obstetrics & Gynecology.2023;[Epub] CrossRef - What is a “high” prevalence of obesity? Two rapid reviews and a proposed set of thresholds for classifying prevalence levels
Tim Lobstein, Jo Jewell
Obesity Reviews.2022;[Epub] CrossRef - Unhealthy Dietary Habits and Obesity: The Major Risk Factors Beyond Non-Communicable Diseases in the Eastern Mediterranean Region
Ayoub Al-Jawaldeh, Marwa M. S. Abbass
Frontiers in Nutrition.2022;[Epub] CrossRef - Changing Trends in Estrogen Receptors/Progesterone Receptors/Human Epidermal Growth Factor Receptor 2 Prevalence Rates Among Jordanian Patients With Breast Cancer Over the Years
Anas M. Alsughayer, Tamara Z. Dabbagh, Rashid H. Abdel-Razeq, Ghada N. Al-Jussani, Salam Alhassoon, Maher A. Sughayer
JCO Global Oncology.2022;[Epub] CrossRef - Healthy nutritional behavior during COVID-19 lockdown: A cross-sectional study
Hayder Al-Domi, Anfal AL-Dalaeen, Sara AL-Rosan, Nour Batarseh, Hala Nawaiseh
Clinical Nutrition ESPEN.2021; 42: 132. CrossRef - Overweight and Obesity among Adults in Iraq: Prevalence and Correlates from a National Survey in 2015
Supa Pengpid, Karl Peltzer
International Journal of Environmental Research and Public Health.2021; 18(8): 4198. CrossRef - Underweight and overweight/obesity among adults in Afghanistan: prevalence and correlates from a national survey in 2018
Supa Pengpid, Karl Peltzer
Journal of Health, Population and Nutrition.2021;[Epub] CrossRef - The Prevalence of Overweight and Obesity Among Women in Jordan: A Risk Factor for Developing Chronic Diseases
Mona Bustami, Khalid Z Matalka, Eyad Mallah, Luay Abu-Qatouseh, Wael Abu Dayyih, Nour Hussein, Nayef Abu Safieh, Yousef Elyyan, Nagham Hussein, Tawfiq Arafat
Journal of Multidisciplinary Healthcare.2021; Volume 14: 1533. CrossRef - Obesity Measures as Predictors of Type 2 Diabetes and Cardiovascular Diseases among the Jordanian Population: A Cross-Sectional Study
Hana Alkhalidy, Aliaa Orabi, Khadeejah Alnaser, Islam Al-Shami, Tamara Alzboun, Mohammad D. Obeidat, Dongmin Liu
International Journal of Environmental Research and Public Health.2021; 18(22): 12187. CrossRef - Review of the Nutrition Situation in Jordan: Trends and Way Forward
Narmeen Jamal Al-Awwad, Jennifer Ayoub, Rawhieh Barham, Wafaa Sarhan, Murad Al-Holy, Mahmoud Abughoush, Huda Al-Hourani, Amin Olaimat, Ayoub Al-Jawaldeh
Nutrients.2021; 14(1): 135. CrossRef
 PubReader
 ePub Link
 Cite
Cite
Figure 1.
| Characteristics | Men | Women | Total (n) | p-value |
|---|---|---|---|---|
| Age (yr) | <0.001 | |||
| <40 | 335 (28.1) | 1,208 (42.3) | 1,543 | |
| 40-50 | 361 (30.3) | 855 (29.9) | 1,216 | |
| >50 | 495 (41.6) | 793 (27.8) | 1,288 | |
| Region | <0.001 | |||
| Northern | 390 (32.7) | 922 (32.2) | 1,312 | |
| Central | 471 (39.5) | 1,295 (45.2) | 1,766 | |
| Southern | 332 (27.8) | 646 (22.6) | 978 | |
| Type of residential area | 0.023 | |||
| Rural | 88 (7.4) | 275 (9.6) | 363 | |
| Urban | 1,105 (92.6) | 2,588 (90.4) | 3,693 | |
| Marital status | ||||
| Single | 144 (12.1) | 462 (16.1) | 606 | 0.001 |
| Married | 1,049 (87.9) | 2,401 (83.9) | 3,450 | |
| Nationality | ||||
| Jordanian | 1,117 (94.0) | 2,669 (93.9) | 3,786 | 0.893 |
| Syrian | 71 (6.0) | 173 (6.1) | 244 | |
| Smoking | <0.001 | |||
| None | 592 (49.6) | 2,628 (91.8) | 3,220 | |
| Past | 206 (17.3) | 46 (1.6) | 252 | |
| Current | 395 (33.1) | 189 (6.6) | 584 | |
| Previously diagnosed diabetes | 326 (34.6) | 433 (18.8) | 759 | <0.001 |
| Previously diagnosed hypertension | 336 (39.2) | 614 (26.6) | 950 | <0.001 |
| Elevated triglycerides | 646 (54.6) | 1,036 (36.5) | 1,682 | <0.001 |
| Low HDL | 727 (61.4) | 1,649 (58.2) | 2,376 | 0.057 |
| High blood pressure or on antihypertensive medication | 647 (54.4) | 1,079 (38.2) | 1,726 | <0.001 |
| High fasting blood sugar (>100 mg/dL) or on antidiabetic medication | 560 (47.4) | 940 (33.3) | 1,500 | <0.001 |
| Physical activity (hr/wk) | ||||
| Light | 12.7±14.9 | 7.5±10.1 | <0.001 | |
| Moderate | 12.2±17.7 | 13.3±14.2 | <0.001 | |
| Hard | 4.4±10.8 | 1.8±4.8 | <0.001 | |
| Consumed vegetables at least 3 times a day (d/wk) | 2.4±2.4 | 3.0±2.7 | <0.001 |
| Variables | Men | Women | p-value |
|---|---|---|---|
| Waist circumference (cm) | 98.9±15.1 | 92.7±16.6 | <0.001 |
| Hip circumference (cm) | 104.7±11.4 | 108.3±13.9 | <0.001 |
| Waist-to-hip ratio | 0.94±0.09 | 0.86±0.11 | <0.001 |
| Waist-to-height ratio | 0.57±0.09 | 0.59±0.11 | <0.001 |
| Body mass index (kg/m2) | 28.4±4.8 | 30.0±6.4 | <0.001 |
| SBP (mmHg) | 127.1±19.6 | 118.3±19.7 | <0.001 |
| DBP (mmHg) | 79.5±11.7 | 75.0±11.6 | <0.001 |
| Total cholesterol (mg/dL) | 193.3±45.8 | 197.5±41.7 | 0.004 |
| HDL cholesterol (mg/dL) | 38.2±9.5 | 48.6±12.3 | <0.001 |
| LDL cholesterol (mg/dL) | 125.0±37.3 | 126.9±36.3 | 0.135 |
| Triglycerides (mg/dL) | 203.8±209.3 | 147.3±110.6 | <0.001 |
| Blood sugar (mg/dL) | 114.3±48.6 | 103.1±35.9 | <0.001 |
| Obesity indicator | Men |
Women |
||
|---|---|---|---|---|
| Crude prevalence, % |
Standardized rate, % (95% CI) | Crude prevalence, % |
Standardized rate, % (95% CI) | |
| Body mass index ≥25 kg/m2 | 77.3 | 77.2 (69.4, 74.9) | 77.3 | 74.5 (72.9, 76.0) |
| Waist circumference (IDF criteria) | 67.3 | 60.4 (57.6, 63.2) | 77.8 | 75.6 (74.2, 77.0) |
| Waist circumference (ATP III criteria) | 41.5 | 36.5 (33.8, 39.3) | 62.8 | 60.7 (59.1, 62.2) |
| Waist-to-hip ratio (WHO criteria) | 71.8 | 63.4 (60.6, 66.0) | 48.5 | 47.5 (45.8, 49.1) |
| Waist-to-height ratio (Jordan-specific cut-off values) | 52.1 | 44.2 (41.5, 46.9) | 49.4 | 47.8 (46.2, 49.3) |
| Variables | Men | p-value | Women | p-value |
|---|---|---|---|---|
| Age (yr) | <0.001 | <0.001 | ||
| 20-29 | 41 (26.6) | 244 (42.3) | ||
| 30-39 | 114 (64.4) | 447 (72.4) | ||
| 40-49 | 230 (73.5) | 665 (88.2) | ||
| 50-59 | 222 (76.0) | 510 (94.1) | ||
| 60-69 | 119 (77.8) | 244 (99.2) | ||
| ≥70 | 71 (74.7) | 83 (98.8) | ||
| Region | <0.001 | <0.001 | ||
| Northern | 258 (66.5) | 753 (82.4) | ||
| Central | 280 (59.6) | 921 (71.2) | ||
| Southern | 259 (79.2) | 524 (84.5) | ||
| Type of residential area | 0.555 | 0.287 | ||
| Rural | 61 (70.1) | 220 (80.3) | ||
| Urban | 736 (67.0) | 1978 (77.5) | ||
| Marital status | <0.001 | <0.001 | ||
| Single | 40 (28.2) | 197 (43.2) | ||
| Married | 757 (72.6) | 2,001 (84.4) | ||
| Smoking status | <0.001 | 0.360 | ||
| None | 406 (69.0) | 2,010 (77.5) | ||
| Past | 168 (82.4) | 39 (84.8) | ||
| Current | 223 (56.7) | 149 (80.1) |
| Variables | Men | p-value | Women | p-value |
|---|---|---|---|---|
| Age (yr) | ||||
| <40 | 1.0 (reference) | 1.0 (reference) | ||
| 40-50 | 2.0 (1.3, 2.9) | 0.001 | 4.2 (3.3, 5.5) | <0.001 |
| >50 | 2.3 (1.6, 3.4) | <0.001 | 15.0 (9.8, 22.9) | <0.001 |
| Region | ||||
| Northern | 1.0 (reference) | 1.0 (reference) | ||
| Central | 0.7 (0.5, 1.0) | 0.029 | 0.5 (0.4, 0.6) | <0.001 |
| Southern | 2.1 (1.4, 3.1) | <0.001 | 1.0 (0.7, 1.4) | 0.939 |
| Marital status (married vs. single) | 3.8 (2.4, 6.2) | <0.001 | 4.3 (3.3, 5.5) | <0.001 |
| Smoking | ||||
| None | 1.0 (reference) | |||
| Past | 1.5 (1.0, 2.3) | 0.066 | - | |
| Current | 0.6 (0.4, 0.8) | <0.001 | - | |
| Hard physical activity (hr/wk) | 0.98 (0.97, 0.99) | 0.005 | 0.97 (0.96, 0.99) | 0.003 |
| Average no. of daily meals | 1.04 (1.01, 1.08) | 0.017 | - |
| Variables | Men | p-value | Women | p-value |
|---|---|---|---|---|
| Diabetes mellitus | 2.1 (1.6, 2.8) | <0.001 | 2.9 (2.1, 3.9) | <0.001 |
| Hypertension | 2.4 (1.8, 3.1) | <0.001 | 2.5 (1.9, 3.3) | <0.001 |
| Elevated triglycerides | 2.5 (1.9, 3.2) | <0.001 | 4.2 (3.1, 5.6) | <0.001 |
| Low HDL | 2.2 (1.7, 2.8) | <0.001 | 2.1 (1.7, 2.5) | <0.001 |
Values are presented as number (%) or mean±standard deviation. HDL, high-density lipoprotein.
Values are presented as mean±standard deviation. SBP, systolic blood pressure; DBP, diastolic blood pressure; HDL, high-density lipoprotein; LDL, low-density lipoprotein.
CI, confidence interval; IDF, International Diabetes Federation; ATP III, Adult Treatment Panel III; WHO, World Health Organization. Men: 41.2% overweight and 36.1% obese; Women: 29.1% overweight and 48.2% obese.
Values are presented as number (%).
Values are presented as odds ratio (95% confidence interval). IDF, International Diabetes Federation.
Values are presented as odds ratio (95% confidence interval). HDL, high-density lipoprotein.

