
Articles
- Page Path
- HOME > Epidemiol Health > Volume 35; 2013 > Article
-
Original Article
Factors Associated with a Low-sodium Diet: The Fourth Korean National Health and Nutrition Examination Survey - Won Joon Lee, Hyeon Chang Kim, Sun Min Oh, Dong Phil Choi, Jaelim Cho, Il Suh
-
Epidemiol Health 2013;35:e2013005.
DOI: https://doi.org/10.4178/epih/e2013005
Published online: June 20, 2013
Department of Preventive Medicine, Yonsei University College of Medicine, Seoul, Korea.
- Correspondence: Hyeon Chang Kim, MD, PhD. Department of Preventive Medicine, Yonsei University College of Medicine, 50 Yonsei-ro, Seodaemun-gu, Seoul 120-752, Korea. Tel: +82-2-2228-1873, Fax: +82-2-392-8133, hckim@yuhs.ac
© 2013, Korean Society of Epidemiology
This is an open-access article distributed under the terms of the Creative Commons Attribution License (http://creativecommons.org/licenses/by/3.0/), which permits unrestricted use, distribution, and reproduction in any medium, provided the original work is properly cited.
- 24,436 Views
- 127 Download
- 16 Crossref


Figure & Data
References
Citations
- Comparison between 24-hour diet recall and 24-hour urine collection for estimating sodium and potassium intakes and their ratio among Korean adults
Taisun Hyun, Mi-Kyeong Choi, Young-Ran Heo, Heekyong Ro, Young-Hee Han, Yeon-Kyung Lee
Nutrition Research and Practice.2023; 17(2): 284. CrossRef - Association between Eating Habits and Sodium Intake among Chinese University Students
Minchan Wu, Yue Xi, Jiaqi Huo, Caihong Xiang, Cuiting Yong, Jiajing Liang, Hanshuang Zou, Yunfeng Pan, Qingqing Xie, Qian Lin
Nutrients.2023; 15(7): 1570. CrossRef - Sodium and Potassium Urinary Excretion Among Malaysian Adults Claiming to Practice Salt-control: Findings from the Malaysian Community Salt Survey (MyCoSS)
Munawara Pardi, Syafinaz Mohd Sallehuddin, Lalitha Palaniveloo, Norazizah Wong Ibrahim
Malaysian Journal of Medicine and Health Sciences.2022; 18(6): 5. CrossRef - Estimation of salt intake assessed by 24-h urinary sodium level among adults speaking different dialects from the Chaoshan region of southern China
Fen Cai, Wen-Ya Dong, Jia-Xin Jiang, Xiao-Li Chen, Yue Wang, Chang-Yu Deng, Qing-Ying Zhang
Public Health Nutrition.2021; 24(2): 290. CrossRef - Mood and Metabolic Health Status of Elderly Osteoporotic Patients in Korea: A Cross-Sectional Study of a Nationally Representative Sample
Hyen Chul Jo, Gu-Hee Jung, Seong-Ho Ok, Ji Eun Park, Jong Chul Baek
Healthcare.2021; 9(1): 77. CrossRef - Prevalence of prehypertension and its risk factors in midlife and late life: Indonesian family life survey 2014–2015
Aida Lydia, Siti Setiati, Czeresna Heriawan Soejono, Rahmi Istanti, Jessica Marsigit, Muhammad Khifzhon Azwar
BMC Public Health.2021;[Epub] CrossRef - Regional disparities in healthy eating and nutritional status in South Korea: Korea National Health and Nutrition Examination Survey 2017
Jounghee Lee, Jaesin Sa
Nutrition Research and Practice.2020; 14(6): 679. CrossRef - Inverse association of improved adherence to dietary guidelines with metabolic syndrome: the Seoul Metabolic Syndrome Management program
Dongwoo Ham, YoungYun Cho, Mi-Suk Park, Yun-Sug Park, Sun-Young Kim, Hye-Min Seol, Yoo Mi Park, Sunok Woo, Hyojee Joung, Do-Sun Lim
Nutrition Research and Practice.2020; 14(6): 621. CrossRef - Association between family dinner and BMI in adults: data from the 2013 to 2015 Korean National Health and Nutrition Examination Survey
Woongchan Rah, Jaewon So, Eun-Cheol Park, Sang Ah Lee, Sung-In Jang
Public Health Nutrition.2019; 22(4): 681. CrossRef - Global Impact of the 2017 American College of Cardiology/American Heart Association Hypertension Guidelines
Hyeon Chang Kim, Yong Woo Jeon, Sung Taik Heo
Circulation.2018; 138(21): 2312. CrossRef - Sodium excretion and health-related quality of life: the results from the Korea National Health and Nutrition Examination Survey 2010–2011
Hye Min Choi, Kyu-Beck Lee, Hyang Kim, Young Youl Hyun
European Journal of Clinical Nutrition.2018; 72(11): 1490. CrossRef - Trends in Blood Pressure and Prevalence of Hypertension in Korean Adults Based on the 1998–2014 KNHANES
Tae-Jong Kim, Jae-woo Lee, Hee-Taik Kang, Myeong-Chan Cho, Hyoung-Ji Lim, Jin-Young Kim, Jang-Whan Bae, Yong-Jae Lee, Sang-Hyun Lee, John A. Linton, Yeseul Kim
Yonsei Medical Journal.2018; 59(3): 356. CrossRef - Socioeconomic Determinants of Sodium Intake in Adult Populations of High-Income Countries: A Systematic Review and Meta-Analysis
Carlos de Mestral, Ana-Lucia Mayén, Dusan Petrovic, Pedro Marques-Vidal, Murielle Bochud, Silvia Stringhini
American Journal of Public Health.2017; 107(4): e1. CrossRef - Factors Associated With High Sodium Intake Based on Estimated 24-Hour Urinary Sodium Excretion
Jae Won Hong, Jung Hyun Noh, Dong-Jun Kim
Medicine.2016; 95(9): e2864. CrossRef - Evaluation of dietary intake in Korean adults according to energy intake from eating-out: Based on 2013~2014 Korea National Health and Nutrition Examination Survey
Yun-Jung Bae
Journal of Nutrition and Health.2016; 49(6): 482. CrossRef - The Korea National Health and Nutrition Examination Survey (KNHANES): current status and challenges
Yuna Kim
Epidemiology and Health.2014; 36: e2014002. CrossRef
 PubReader
 ePub Link
 Cite
Cite- Figure
-
- Related articles
-
- Individual- and neighborhood-level factors influencing diet quality: a multilevel analysis using Korea National Health and Nutrition Examination Survey data, 2010-2019
- Sugar-sweetened beverage consumption and metabolic dysfunction-associated steatotic liver disease: a beverage type-specific analysis using Korea National Health and Nutrition Examination Survey
- Health literacy in Korea: findings from the 2023 Korea National Health and Nutrition Examination Survey
- Association of dietary inflammatory index with mortality risk: a prospective analysis of the Korea National Health and Nutrition Examination Survey
- Prevalence of cardiovascular-kidney-metabolic syndrome in Korea: Korea National Health and Nutrition Examination Survey 2011-2021
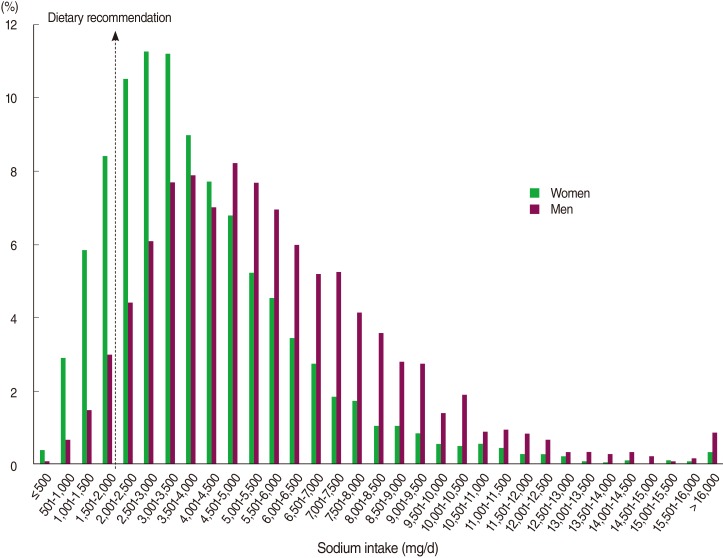
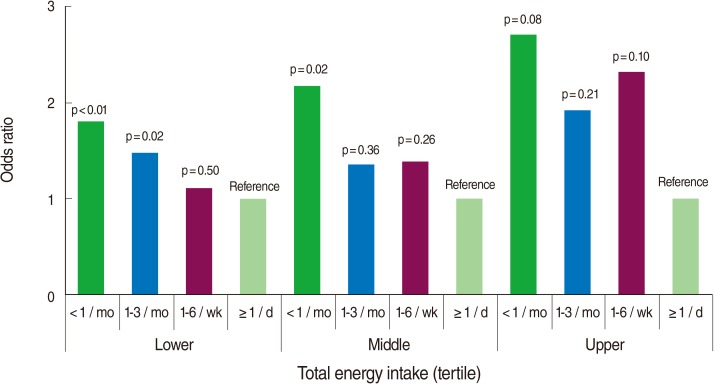
Figure 1
Figure 2
| Variable | Participants | Estimated in population | |
|---|---|---|---|
| Sex | Women | 8,855 (60.9) | 16,310,414 (54.6) |
| Men | 5,684 (39.1) | 13,545,469 (45.4) | |
| Age (yr) | ≥70 | 2,252 (15.5) | 2,855,980 (9.6) |
| 60-69 | 2,492 (17.1) | 3,371,828 (11.3) | |
| 50-59 | 2,484 (17.1) | 5,034,910 (16.9) | |
| 40-49 | 2,842 (19.5) | 6,744,018 (22.6) | |
| 20-39 | 4,469 (30.7) | 11,849,146 (39.7) | |
| Education (yr) | ≤6 | 4,451 (30.9) | 6,491,595 (21.9) |
| 7-9 | 1,689 (11.7) | 3,239,359 (10.9) | |
| 10-12 | 4,759 (33.0) | 11,418,848 (38.6) | |
| ≥13 | 3,525 (24.4) | 8,451,486 (28.6) | |
| Family member (n) | 1 | 1,124 (7.3) | 1,748,552 (5.9) |
| 2 | 3,874 (25.1) | 5,970,198 (20.1) | |
| 3 | 3,499 (22.7) | 7,282,805 (24.4) | |
| ≥4 | 6,923 (44.9) | 14,774,456 (49.6) | |
| Household income | ≤ 24th percentile | 3,120 (22.0) | 4,821,325 (16.6) |
| 25-49th percentile | 3,535 (24.9) | 7,297,549 (25.1) | |
| 50-74th percentile | 3,728 (26.3) | 8,278,073 (28.5) | |
| ≥ 75th percentile | 3,786 (26.7) | 8,636,279 (29.7) | |
| Occupation | Managers and professionals | 1,458 (11.1) | 3,636,872 (13.6) |
| Clerical support workers | 923 (7.0) | 2,313,864 (8.6) | |
| Service and sales workers | 1,704 (13.0) | 3,933,077 (14.7) | |
| Skilled agricultural, forestry and fishery workers | 1,506 (11.5) | 1,714,886 (6.4) | |
| Craft, plant or machine operators and assemblers | 1,225 (9.3) | 3,186,674 (11.9) | |
| Elementary occupations | 1,261 (9.6) | 2,499,584 (9.3) | |
| Unemployed (including students and housewives) | 5,041 (38.4) | 9,500,600 (35.5) | |
| Total energy intake | ≤ 24th percentile | 3,663 (25.2) | 6,767,043 (22.7) |
| 25-49th percentile | 3,664 (25.2) | 7,151,055 (24.0) | |
| 50-74th percentile | 3,643 (25.1) | 7,554,263 (25.3) | |
| ≥ 75th percentile | 3,569 (24.5) | 8,383,522 (28.1) | |
| Alcohol drinking | Nondrinker | 2,295 (15.9) | 3,688,639 (12.5) |
| Drinker | 12,139 (84.1) | 25,921,613 (87.5) | |
| Frequency of eating out | <1 / mo | 2,423 (16.7) | 6,735,104 (22.6) |
| 1-3 / mo | 5,327 (36.7) | 11,538,217 (38.7) | |
| 1-6 / wk | 3,937 (27.1) | 7,182,845 (24.1) | |
| ≥1 / d | 2,840 (19.5) | 4,382,887 (14.7) | |
| Hypertension manage- | Hypertension with comorbidity* | 458 (3.2) | 664,198 (2.3) |
| ment status | Hypertension with treatment | 2,259 (15.7) | 3,569,276 (12.1) |
| Hypertension without treatment | 1,638 (11.4) | 3,327,677 (11.3) | |
| Prehypertension | 3,451 (24.0) | 7,321,253 (24.8) | |
| Normotension | 6,582 (45.7) | 14,619,850 (49.6) | |
| Sodium intake (mg/d) | ≤ 2,000 | 2,016 (13.9) | 3,559,822 (11.9) |
| >2,000 | 12,523 (86.1) | 26,296,061 (88.1) |
| Variable | Sodium intake (mg/d) |
|---|---|
| Mean (95% confidence interval) | |
| Sex | |
| Women | 4,044 (3,976-4,113) |
| Men | 5,718 (5,621-5,815) |
| Age (yr) | |
| ≥70 | 3,587 (3,452-3,722) |
| 60-69 | 4,407 (4,264-4,550) |
| 50-59 | 4,959 (4,807-5,111) |
| 40-49 | 5,266 (5,147-5,385) |
| 20-39 | 4,880 (4,781-4,978) |
| Education (yr) | |
| ≤6 | 4,087 (3,980-4,193) |
| 7-9 | 4,861 (4,693-5,028) |
| 10-12 | 5,014 (4,911-5,117) |
| ≥13 | 5,060 (4,958-5,162) |
| Family member (n) | |
| 1 | 4,306 (4,080-4,533) |
| 2 | 4,652 (4,518-4,787) |
| 3 | 4,805 (4,684-4,927) |
| ≥4 | 4,920 (4,834-5,007) |
| Household income | |
| ≤ 24th percentile | 4,153 (4,031-4,275) |
| 25-49th percentile | 4,736 (4,619-4,854) |
| 50-74th percentile | 5,055 (4,930-5,179) |
| ≥ 75th percentile | 5,022 (4,913-5,132) |
| Occupation | |
| Managers and professionals | 5,296 (5,124-5,467) |
| Clerical support workers | 5,400 (5,204-5,595) |
| Service and sales workers | 4,872 (4,707-5,037) |
| Skilled agricultural, forestry and fishery workers | 5,010 (4,778-5,241) |
| Craft, plant or machine operators and assemblers | 5,821 (5,643-5,998) |
| Elementary occupations | 4,801 (4,610-4,993) |
| Unemployed (including students and housewives) | 4,213 (4,116-4,310) |
| Total energy intake | |
| ≤ 24th percentile | 2,814 (2,746-2,882) |
| 25-49th percentile | 4,006 (3,920-4,092) |
| 50-74th percentile | 5,114 (5,014-5,214) |
| ≥ 75th percentile | 6,810 (6,678-6,941) |
| Alcohol drinking | |
| Nondrinker | 4,075 (3,925-4,224) |
| Drinker | 4,911 (4,843-4,979) |
| Frequency of eating out | |
| <1 / mo | 3,929 (3,791-4,067) |
| 1-3 / mo | 4,373 (4,264-4,483) |
| 1-6 / wk | 4,992 (4,891-5,092) |
| ≥1 / d | 5,510 (5,388-5,632) |
| Hypertension management status | |
| Hypertension with comorbidity* | 3,898 (3,646-4,150) |
| Hypertension with treatment | 4,431 (4,272-4,590) |
| Hypertension without treatment | 5,042 (4,864-5,219) |
| Prehypertension | 5,114 (4,997-5,232) |
| Normotension | 4,734 (4,648-4,819) |
| Variable | Low-sodium diet n (%) | Unadjusted OR (95% CI) | Adjusted* OR (95% CI) | |
|---|---|---|---|---|
| Sex | Women | 1,647 (18.6) | 3.85 (3.34-4.43) | 1.55 (1.28-1.89) |
| Men | 369 (6.5) | 1.00 | 1.00 | |
| Age (yr) | ≥70 | 616 (27.4) | 3.39 (2.90-3.97) | 1.13 (0.83-1.53) |
| 60-69 | 392 (15.7) | 1.56 (1.31-1.86) | 0.78 (0.59-1.04) | |
| 50-59 | 314 (12.6) | 1.17 (0.98-1.40) | 0.88 (0.68-1.15) | |
| 40-49 | 236 (8.3) | 0.75 (0.63-0.90) | 0.63 (0.50-0.79) | |
| 20-39 | 458 (10.2) | 1.00 | 1.00 | |
| Education (yr) | ≤6 | 1,005 (22.6) | 2.97 (2.51-3.51) | 0.98 (0.71-1.34) |
| 7-9 | 220 (13.0) | 1.48 (1.19-1.84) | 0.96 (0.69-1.32) | |
| 10-12 | 469 (9.9) | 1.16 (0.97-1.38) | 0.83 (0.66-1.04) | |
| ≥13 | 293 (8.3) | 1.00 | 1.00 | |
| Family member (n) | 1 | 307 (27.3) | 2.37 (1.94-2.89) | 1.31 (1.04-1.66) |
| 2 | 610 (15.8) | 1.45 (1.26-1.68) | 1.14 (0.95-1.38) | |
| 3 | 450 (12.9) | 1.15 (0.98-1.34) | 1.19 (0.98-1.44) | |
| ≥4 | 745 (10.8) | 1.00 | 1.00 | |
| Household income | ≤ 24th percentile | 689 (22.1) | 2.42 (2.03-2.88) | 1.13 (0.88-1.45) |
| 25-49th percentile | 481 (13.6) | 1.42 (1.20-1.68) | 1.07 (0.87-1.32) | |
| 50-74th percentile | 408 (10.9) | 1.10 (0.93-1.30) | 1.04 (0.85-1.28) | |
| ≥ 75th percentile | 369 (9.7) | 1.00 | 1.00 | |
| Occupation | Managers and professionals | 112 (7.7) | 0.35 (0.28-0.45) | 0.84 (0.62-1.13) |
| Clerical support workers | 50 (5.4) | 0.26 (0.18-0.3б) | 0.57 (0.39-0.83) | |
| Service and sales workers | 189 (11.1) | 0.54 (0.44-0.66) | 0.92 (0.73-1.17) | |
| Skilled agricultural, forestry and fishery workers | 221 (14.7) | 0.70 (0.57-0.86) | 0.94 (0.74-1.21) | |
| Craft, plant or machine operators and assemblers | 65 (5.3) | 0.21 (0.16-0.28) | 0.77 (0.54-1.00) | |
| Elementary occupations | 163 (12.9) | 0.61 (0.49-0.77) | 0.85 (0.66-1.12) | |
| Unemployed (including students and housewives) | 943 (18.7) | 1.00 | 1.00 | |
| Total energy intake | ≤ 24th percentile | 1,334 (36.4) | 44.53 (31.93-62.09) | 25.82 (18.08-36.89) |
| 25-49th percentile | 461 (12.6) | 10.75 (7.65-15.10) | 719 (5.01-10.31) | |
| 50-74th percentile | 165 (4.5) | 3.43 (2.39-4.91) | 2.58 (1.75-3.80) | |
| ≥ 75th percentile | 56 (1.6) | 1.00 | 1.00 | |
| Alcohol drinking | Nondrinker | 522 (22.8) | 2.16 (1.89-2.47) | 1.09 (0.92-1.28) |
| Drinker | 1,464 (12.1) | 1.00 | 1.00 | |
| Frequency of eating | < 1 / mo | 723 (29.8) | 5.15 (4.14-6.42) | 2.01 (1.51-2.67) |
| out | 1-3 / mo | 606 (11.4) | 2.96 (2.39-3.67) | 1.51 (1.16-1.97) |
| 1-6 / wk | 540 (13.7) | 1.70 (1.36-2.13) | 1.27 (0.98-1.64) | |
| ≥1 / d | 145 (5.1) | 1.00 | 1.00 | |
| Hypertension | Hypertension with comorbidity† | 102 (22.3) | 2.32 (1.77-3.04) | 1.17 (0.78-1.75) |
| management status | Hypertension with treatment | 432 (19.1) | 1.67 (1.44-1.94) | 1.05 (0.85-1.29) |
| Hypertension without treatment | 246 (15.0) | 1.09 (0.91-1.30) | 1.18 (0.95-1.48) | |
| Prehypertension | 435 (12.6) | 0.96 (0.83-1.10) | 1.13 (0.94-1.35) | |
| Normotension | 769 (11.7) | 1.00 | 1.00 |
Values are presented as number (%). *Comorbidity includes stroke, myocardial infarction, ischemic heart disease, and chronic renal failure.
*Comorbidity includes stroke, myocardial infarction, ischemic heart disease, and chronic renal failure.
OR, odds ratio; CI, confidence interval Statistically significant estimates (p<0.05) appear in bold. *Adjusted for sex, age, education, number of family members, household income, occupation, total energy intake, alcohol drinking, frequency of eating out, and hypertension management status; †Comorbidity includes stroke, myocardial infarction, ischemic heart disease and chronic renal failure.

