
Articles
- Page Path
- HOME > Epidemiol Health > Volume 43; 2021 > Article
-
Original Article
Estimation and change of edentulism among the Korean population: Korea National Health and Nutrition Examination Survey 2007-2018 -
Na-Hyeon Yu1*
 , Ah Ra Shin2*, Song Vogue Ahn3, Keun-Bae Song1, Youn-Hee Choi1
 -
Epidemiol Health 2021;43:e2021020.
DOI: https://doi.org/10.4178/epih.e2021020
Published online: April 2, 2021
1Department of Preventive Dentistry, School of Dentistry, Kyungpook National University, Daegu, Korea
2Department of Dental Hygiene, Gumi University, Gumi, Korea
3Department of Health Convergence, Ewha Womans University, Seoul, Korea
- Correspondence: Youn-Hee Choi Department of Preventive Dentistry, School of Dentistry, Kyungpook National University, 2177 Dalgubeol-daero, Jung-gu, Daegu 41940, Korea E-mail: cyh1001@knu.ac.kr
- *Yu & Shin contributed equally to this work as joint first authors.
©2021, Korean Society of Epidemiology
This is an open-access article distributed under the terms of the Creative Commons Attribution License (http://creativecommons.org/licenses/by/4.0/), which permits unrestricted use, distribution, and reproduction in any medium, provided the original work is properly cited.


Figure & Data
References
Citations
- Occurrence rate and estimated economic burden of pulp and periapical disease treatment among Korean older adults: a national population-based retrospective study
Hyeonjeong Go, Masae Kuboniwa, Youn-Hee Choi
Epidemiology and Health.2025; 47: e2025035. CrossRef - Comparison of the oral health status and costs of the provision of dental care in ten high-income countries
Rüdiger Saekel
Journal of Dental Health, Oral Disorders & Therapy.2024; 15(1): 23. CrossRef - Trend in the Incidence of Severe Partial Edentulism among Adults Using the Korean National Health Insurance Service Claim Data, 2014–2018
Hyeonjeong Go, Hoi-In Jung, Song Vogue Ahn, Jeonghoon Ahn, Hosung Shin, Atsuo Amano, Youn-Hee Choi
Yonsei Medical Journal.2024; 65(4): 234. CrossRef - Impact of public health and patient‐centered prevention strategies on periodontitis and caries as causes of tooth loss in high‐income countries
Thomas Kocher, Peter Meisel, Sebastian Baumeister, Birte Holtfreter
Periodontology 2000.2024;[Epub] CrossRef - Disease burden and health inequality of older adults with edentulism and the projected trend until 2040: based on the global burden of disease study 2021
Weizhen Guan, Jing Li, Qian Liang, Yushan Huang, Shunhang Li, Xiaoshuang Xu, Yilin Zhang, Fei Wang, Xin Xu
Clinical Oral Investigations.2024;[Epub] CrossRef - A preclinical study comparing single- and double-root 3D-printed Ti–6Al–4V implants
Inna Chung, Jungwon Lee, Ling Li, Yang-Jo Seol, Yong-Moo Lee, Ki-Tae Koo
Scientific Reports.2023;[Epub] CrossRef - Oral health status and behavior in elderly Koreans with periodontal disease
Sae‐Rom Lee, Mi Ah Han, Jong Park, So Yeon Ryu, So Yeong Kim
Journal of Public Health Dentistry.2022; 82(4): 378. CrossRef - High exposure to phthalates is associated with HbA1c worsening in type 2 diabetes subjects with and without edentulism: a prospective pilot study
Alessandro Mengozzi, Fabrizia Carli, Samantha Pezzica, Edoardo Biancalana, Amalia Gastaldelli, Anna Solini
Diabetology & Metabolic Syndrome.2022;[Epub] CrossRef - Incidence of edentulism among older adults using the Korean National Health Insurance Service database, 2013-2018
Hyeonjeong Go, Eun-Kyong Kim, Hoi-In Jung, Song Vogue Ahn, Hosung Shin, Atsuo Amano, Youn-Hee Choi
Epidemiology and Health.2022; 44: e2022091. CrossRef
 PubReader
 ePub Link
 Cite
Cite- Figure
-
- Related articles
-
- Individual- and neighborhood-level factors influencing diet quality: a multilevel analysis using Korea National Health and Nutrition Examination Survey data, 2010-2019
- Health literacy in Korea: findings from the 2023 Korea National Health and Nutrition Examination Survey
- Association of dietary inflammatory index with mortality risk: a prospective analysis of the Korea National Health and Nutrition Examination Survey
- Prevalence of cardiovascular-kidney-metabolic syndrome in Korea: Korea National Health and Nutrition Examination Survey 2011-2021
- Importance of younger age group and high inflammatory status in the association between periodontal disease and diabetes mellitus: results from the Korea National Health and Nutrition Examination Survey 2012-2018
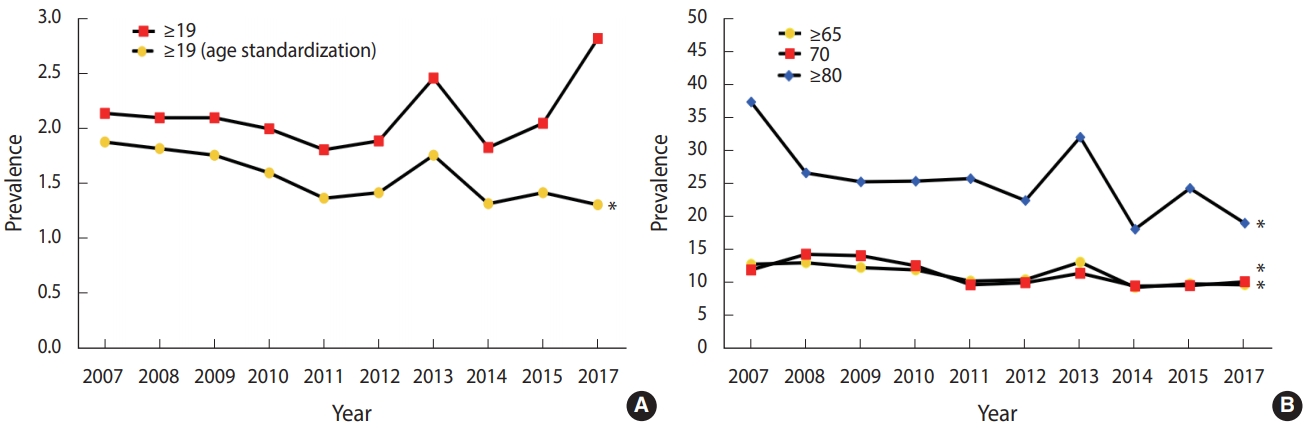
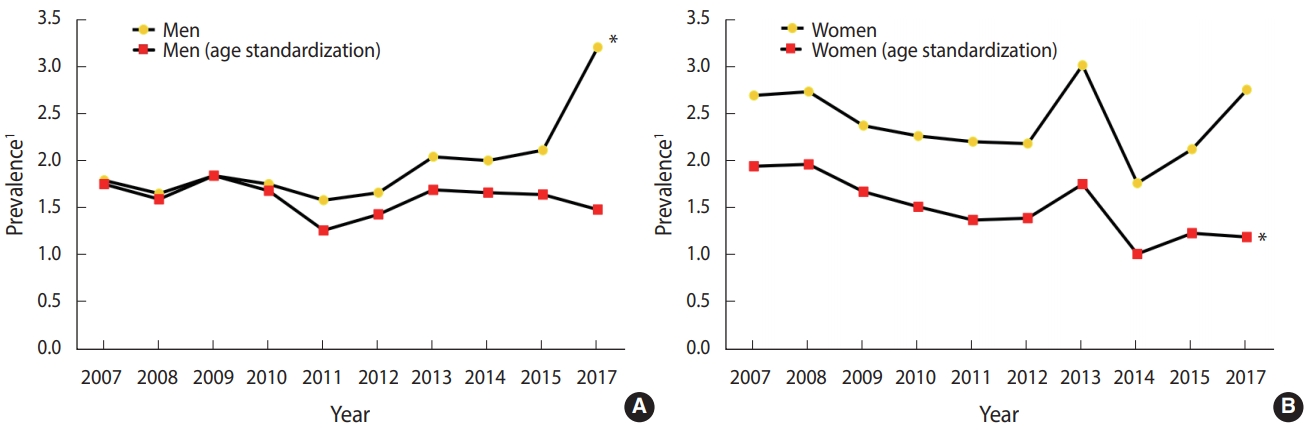
Figure 1.
Figure 2.
| Variables | 2007 | 2008 | 2009 | 2010 | 2011 | 2012 | 2013 | 2014 | 2015 | 2017 |
Trend test p-value | |
|---|---|---|---|---|---|---|---|---|---|---|---|---|
| Age (yr) | ||||||||||||
| ≥19 | 2,925 (2.14) [0.35] | 6,681 (2.10) [0.19] | 7,403 (2.10) [0.19] | 6,206 (2.00) [0.21] | 6,039 (1.81) [0.21] | 5,757 (1.89) [0.21] | 5,439 (2.46) [0.24] | 5,118 (1.83) [0.20] | 5,024 (2.05) [0.20] | 13,199 (2.82) [0.23] | 0.241 | |
| ≥19 (standardization) | 2,925 (1.88) [0.26] | 6,681 (1.82) [0.14] | 7,403 (1.76) [0.14] | 6,206 (1.60) [0.15] | 6,039 (1.37) [0.14] | 5,757 (1.42) [0.13] | 5,439 (1.76) [0.15] | 5,118 (1.32) [0.14] | 5,024 (1.42) [0.13] | 13,199 (1.31) [0.09] | 0.007 | |
| ≥65 | 727 (12.80) [1.92] | 1,497 (13.04) [1.11] | 1,658 (12.31) [1.05] | 1,396 (11.95) [1.27] | 1,521 (10.26) [1.05] | 1,559 (10.48) [1.13] | 1,289 (13.13) [1.15] | 1,399 (9.30) [0.93] | 1,349 (9.85) [0.99] | 3,426 (9.72) [0.72] | 0.014 | |
| 50s | 494 (1.27) [0.58] | 1,116 (1.06) [0.33] | 1,235 (1.03) [0.36] | 1,164 (1.03) [0.26] | 1,168 (1.22) [0.37] | 1,087 (0.65) [0.31] | 1,021 (1.24) [0.42] | 967 (0.85) [0.37] | 1,029 (1.09) [0.49] | 2,493 (0.58) [0.21] | 0.094 | |
| 60s | 479 (4.13) [0.96] | 1,063 (4.35) [0.77] | 1,196 (4.05) [0.68] | 1,011 (3.45) [0.72] | 1,033 (2.43) [0.62] | 1,028 (4.15) [0.73] | 870 (3.63) [0.72] | 890 (3.37) [0.62] | 936 (2.75) [0.66] | 2,256 (3.08) [0.44] | 0.061 | |
| 70s | 371 (11.95) [1.64] | 754 (14.31) [1.52] | 859 (14.10) [1.60] | 734 (12.58) [1.57] | 828 (9.71) [1.18] | 879 (10.02) [1.45] | 669 (11.45) [1.54] | 733 (9.51) [1.32] | 697 (9.59) [1.41] | 1,746 (10.16) [0.93] | 0.017 | |
| ≥80s | 87 (37.30) [7.89] | 195 (26.59) [4.04] | 205 (25.25) [3.48] | 159 (25.35) [4.41] | 206 (25.73) [3.92] | 198 (22.42) [3.78 | 201 (31.99) [3.84] | 220 (18.10) [2.73] | 200 (24.27) [3.22] | 621 (19.01) [1.76] | 0.042 | |
| Gender | ||||||||||||
| Men | 1,215 (1.79) [0.36] | 2,787 (1.65) [0.25] | 3,207 (1.84) [0.25] | 2,678 (1.75) [0.27] | 2,569 (1.58) [0.23] | 2,389 (1.66) [0.28] | 2,336 (2.04) [0.26] | 2,133 (2.00) [0.28] | 2,187 (2.11) [0.29] | 5,793 (3.20) [0.31] | 0.014 | |
| Men (standardization) | 1,215 (1.75) [0.34] | 2,787 (1.59) [0.22] | 3,207 (1.84) [0.22] | 2,678 (1.68) [0.23] | 2,569 (1.26) [0.19] | 2,389 (1.43) [0.22] | 2,336 (1.69) [0.21] | 2,133 (1.66) [0.22] | 2,187 (1.64) [0.21] | 5,793 (1.48) [0.14] | 0.385 | |
| Women | 1,710 (2.69) [0.52] | 3,894 (2.73) [0.28] | 4,196 (2.37) [0.27] | 3,528 (2.26) [0.28] | 3,470 (2.20) [0.32] | 3,368 (2.18) [0.26] | 3,103 (3.01) [0.38] | 2,985 (1.76) [0.24] | 2,837 (2.12) [0.32] | 7,406 (2.75) [0.30] | 0.624 | |
| Women (standardization) | 1,710 (1.94) [0.32] | 3,894 (1.96) [0.18] | 4,196 (1.67) [0.18] | 3,528 (1.51) [0.18] | 3,470 (1.37) [0.17] | 3,368 (1.39) [0.16] | 3,103 (1.75) [0.20] | 2,985 (1.01) [0.13] | 2,837 (1.23) [0.19] | 7,406 (1.19) [0.12] | 0.005 | |
| Variables | 2007 | 2008 | 2009 | 2010 | 2011 | 2012 | 2013 | 2014 | 2015 | 2017 |
Trend test p-value | ||
|---|---|---|---|---|---|---|---|---|---|---|---|---|---|
| Comparison of income level according to standardization | |||||||||||||
| Income level | |||||||||||||
| Poorest | 616 (6.21) [0.93] | 1,368 (7.45) [0.77] | 1,581 (6.48) [0.69] | 1,252 (6.37) [0.90] | 1,212 (7.14) [0.83] | 1,104 (5.96) [0.82] | 1,120 (8.26) [0.86] | 1,034 (6.15) [0.80] | 996 (6.70) [0.86] | 2,641 (9.19) [0.84] | 0.161 | ||
| Poor | 727 (1.84) [0.47] | 1,689 (1.50) [0.28] | 1,707 (2.49) [0.45] | 1,551 (1.54) [0.35] | 1,553 (1.27) [0.32] | 1,469 (2.18) [0.39] | 1,419 (1.38) [0.32] | 1,277 (2.26) [0.47] | 1,207 (2.73) [0.54] | 3,209 (2.70) [0.34] | 0.112 | ||
| Rich | 704 (0.63) [0.24] | 1,692 (0.97) [0.26] | 2,007 (0.78) [0.19] | 1,680 (0.89) [0.27] | 1,635 (0.58) [0.15] | 1,483 (0.39) [0.13] | 1,368 (1.48) [0.32] | 1,429 (0.75) [0.20] | 1,351 (0.77) [0.24] | 3,602 (1.13) [0.20] | 0.417 | ||
| Richest | 726 (0.90) [0.34] | 1,722 (0.94) [0.23] | 2,020 (0.50) [0.16] | 1,639 (0.68) [0.18] | 1,579 (0.69) [0.22] | 1,615 (0.79) [0.27] | 1,492 (1.11) [0.32] | 1,351 (0.47) [0.21] | 1,436 (0.42) [0.17] | 3,709 (0.57) [0.13] | 0.213 | ||
| Income level (standardization) | |||||||||||||
| Poorest | 616 (1.75) [0.25] | 1,368 (2.39) [0.28] | 1,581 (1.84) [0.20] | 1,252 (1.90) [0.26] | 1,212 (1.91) [0.31] | 1,104 (1.35) [0.19] | 1,120 (2.27) [0.33] | 1,034 (1.30) [0.17] | 996 (1.92) [0.36] | 2,641 (1.72) [0.17] | 0.399 | ||
| Poor | 727 (1.95) [0.48] | 1,689 (1.36) [0.25] | 1,707 (2.07) [0.34] | 1,551 (1.56) [0.34] | 1,553 (1.18) [0.25] | 1,469 (1.65) [0.28] | 1,419 (1.01) [0.24] | 1,277 (1.57) [0.31] | 1,207 (1.82) [0.38] | 3,209 (1.24) [0.17] | 0.287 | ||
| Rich | 704 (1.07) [0.42] | 1,692 (1.62) [0.40] | 2,007 (1.29) [0.31] | 1,680 (1.34) [0.40] | 1,635 (0.78) [0.23] | 1,483 (0.58) [0.18] | 1,368 (1.96) [0.39] | 1,429 (0.98) [0.25] | 1,351 (0.87) [0.25] | 3,602 (0.93) [0.16] | 0.425 | ||
| Richest | 726 (1.39) [0.60] | 1,722 (1.87) [0.39] | 2,020 (0.99) [0.26] | 1,639 (1.08) [0.29] | 1,579 (1.16) [0.35] | 1,615 (1.18) [0.37] | 1,492 (1.85) [0.51] | 1,351 (0.66) [0.25] | 1,436 (0.62) [0.25] | 3,709 (0.77) [0.18] | 0.089 | ||
| Comparison of education level according to standardization | |||||||||||||
| Education level | |||||||||||||
| None or elementary school | 921 (8.02) [1.30] | 1,981 (8.87) [0.75] | 2,052 (7.80) [0.68] | 1,568 (6.79) [0.81] | 1,545 (7.50) [0.88] | 1,424 (6.01) [0.77] | 1,226 (8.62) [1.00] | 1,120 (5.98) [0.78] | 1,095 (7.46) [0.82] | 2,629 (8.98) [0.76] | 0.875 | ||
| Middle school | 315 (1.83) [0.69] | 749 (1.91) [0.51] | 820 (1.84) [0.52] | 662 (2.18) [0.54] | 655 (1.46) [0.46] | 590 (1.96) [0.53] | 526 (2.20) [0.69] | 496 (2.51) [0.68] | 510 (3.77) [1.17] | 1,233 (3.58) [0.63] | 0.006 | ||
| High school | 942 (0.53) [0.22] | 2,253 (0.13) [0.06] | 2,560 (0.42) [0.11] | 2,028 (0.46) [0.16] | 1,954 (0.28) [0.10] | 1,815 (0.69) [0.26] | 1,780 (0.88) [0.24] | 1,518 (0.74) [0.18] | 1,522 (0.59) [0.19] | 4,028 (1.20) [0.20] | 0.008 | ||
| College or university | 703 (0.10) [0.08] | 1,674 (0.35) [0.17] | 1,911 (0.19) [0.12] | 1,868 (0.25) [0.09] | 1,746 (0.32) [0.14] | 1,633 (0.06) [0.03] | 1,571 (0.31) [0.13] | 1,467 (0.39) [0.20] | 1,498 (0.35) [0.15] | 4,676 (0.36) [0.10] | 0.124 | ||
| Education level (standardization) | |||||||||||||
| None or elementary school | 921 (2.97) [0.48] | 1,981 (2.25) [0.20] | 2,052 (1.98) [0.20] | 1,568 (1.57) [0.19] | 1,545 (1.79) [0.26] | 1,424 (2.56) [0.31] | 1,226 (1.93) [0.28] | 1,120 (1.19) [0.16] | 1095 (1.55) [0.23] | 2,629 (1.34) [0.12] | 0.021 | ||
| Middle school | 315 (1.62) [0.56] | 749 (1.13) [0.34] | 820 (1.38) [0.37] | 662 (1.34) [0.35] | 655 (0.82) [0.27] | 590 (0.97) [0.25] | 526 (1.03) [0.32] | 496 (1.19) [0.28] | 510 (2.14) [0.99] | 1,233 (1.13) [0.22] | 0.936 | ||
| High school | 942 (1.73) [0.61] | 2,253 (0.42) [0.22] | 2,560 (1.10) [0.32] | 2,028 (1.22) [0.42] | 1,954 (0.65) [0.26] | 1,815 (1.19) [0.42] | 1,780 (1.26) [0.33] | 1,518 (1.33) [0.32] | 1,522 (0.80) [0.24] | 4,028 (1.04) [0.18] | 0.836 | ||
| College or university | 703 (0.60) [0.43] | 1,674 (0.62) [0.26] | 1,911 (0.49) [0.23] | 1,868 (0.92) [0.39] | 1,746 (0.97) [0.48] | 1,633 (0.18) [0.09] | 1,571 (0.83) [0.36] | 1,467 (0.64) [0.27] | 1,498 (1.08) [0.44] | 4676 (0,.58) [0.15] | 0.650 | ||
Values are presented as unweighted number (% weighted proportion) [standard error]. Crude prevalence means real magnitude of edentulism at the time of the survey. Analyzed from the 2016-2018 data.
Values are presented as unweighted number (% weighted proportion)/[standard error]. Crude prevalence means real magnitude of edentulism at the time of the survey. Analyzed from the 2016-2018 data.

