
Articles
- Page Path
- HOME > Epidemiol Health > Volume 41; 2019 > Article
-
Original Article
The double burden of malnutrition among adults in India: evidence from the National Family Health Survey-4 (2015-16) -
Mili Dutta1
 , Y Selvamani2, Pushpendra Singh3, Lokender Prashad4
 -
Epidemiol Health 2019;41:e2019050.
DOI: https://doi.org/10.4178/epih.e2019050
Published online: December 18, 2019
1International Institute for Population Sciences (IIPS), Mumbai, India
2Department of Development Studies, International Institute for Population Sciences (IIPS), Mumbai, India
3Department of Humanities and Social Sciences, Indian Institute of Technology Roorkee, Roorkee, India
4Tata Institute of Social Sciences, Mumbai, India
- Correspondence: Y Selvamani Department of Development Studies, International Institute for Population Sciences (IIPS), Govandi Station Road, Mumbai 400088, India E-mail: selvinsw@gmail.com
©2019, Korean Society of Epidemiology
This is an open-access article distributed under the terms of the Creative Commons Attribution License (http://creativecommons.org/licenses/by/4.0/), which permits unrestricted use, distribution, and reproduction in any medium, provided the original work is properly cited.


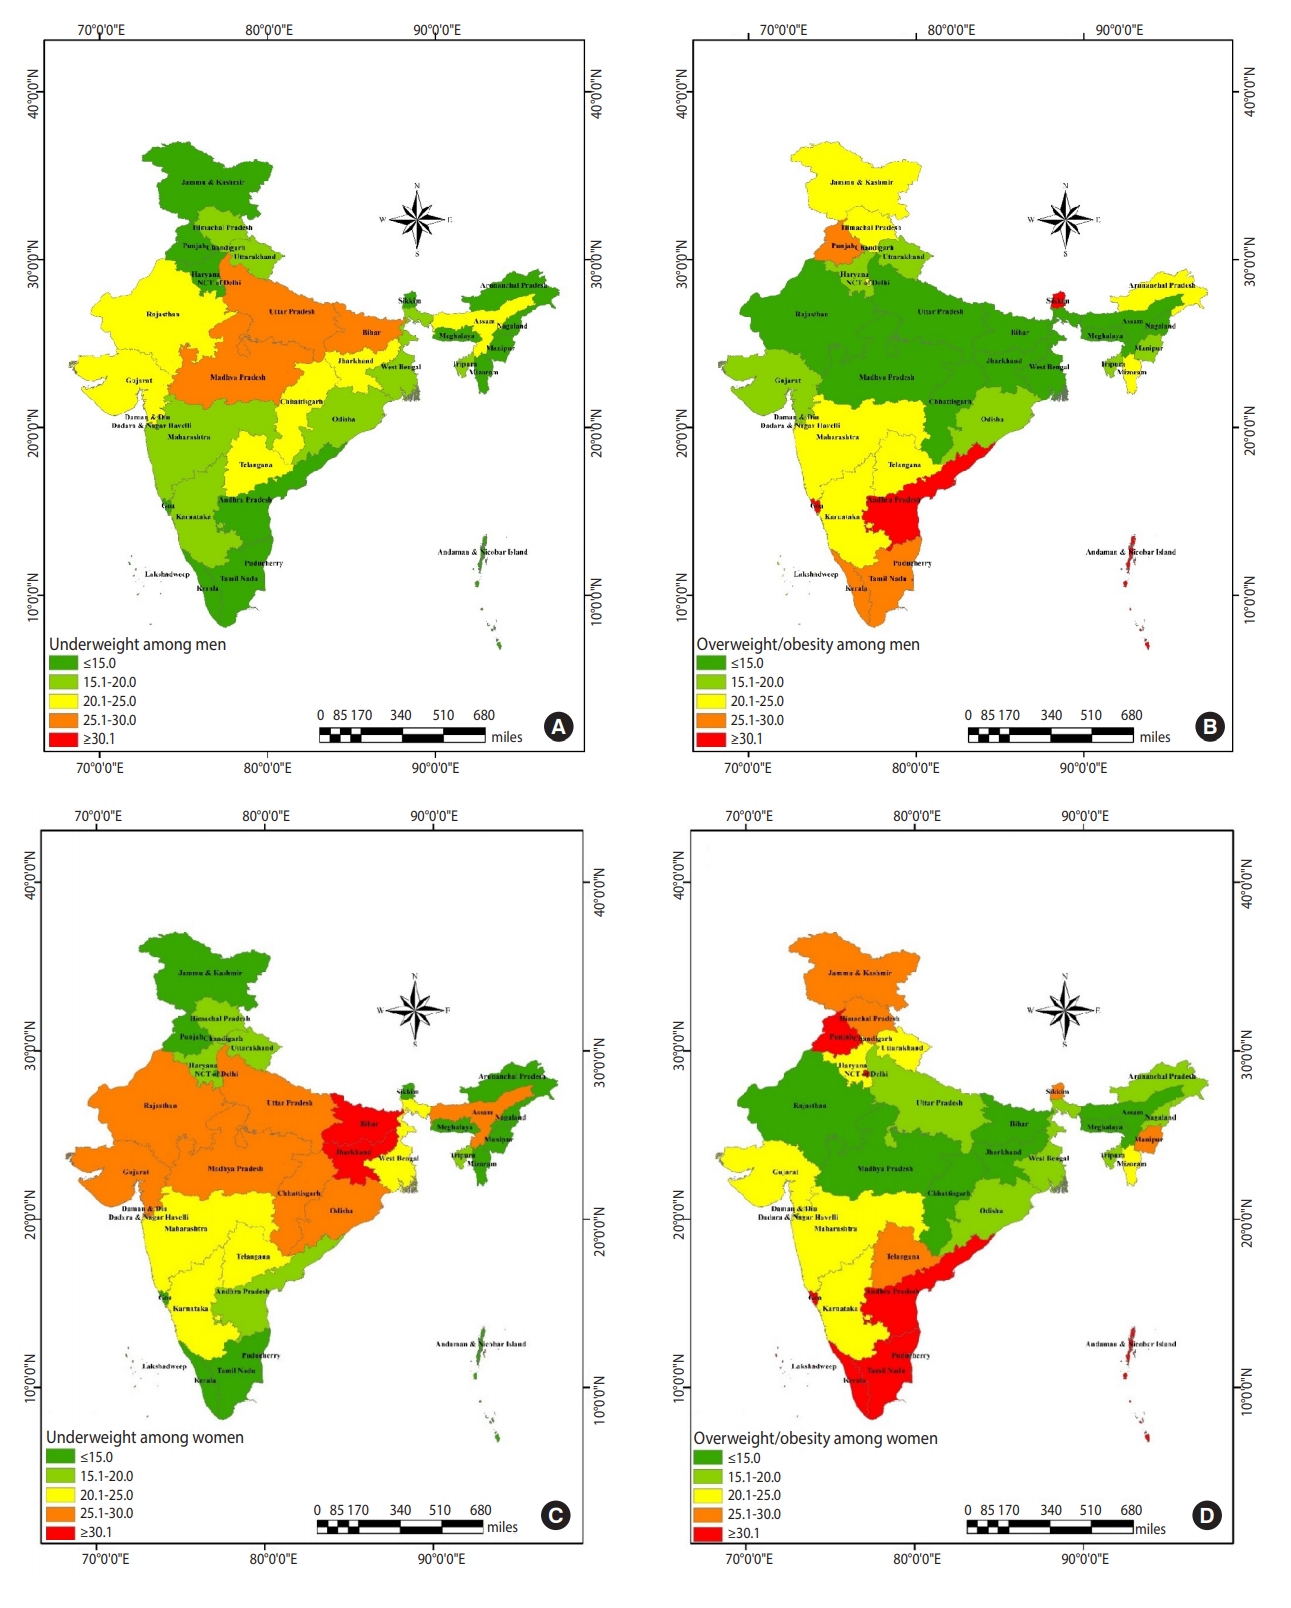
Figure & Data
References
Citations
- Exploring adaptive health technology assessment for evaluating 10 cancer interventions: insights and lessons from a pilot study in India
Srobana Ghosh, C S Pramesh, Manju Sengar, Priya Ranganathan, Francis Ruiz, Tabassum Wadasadawala, Prakash Nayak, Jayashree Thorat, Apurva Ashok, Malkeet Singh, Abha Mehndiratta, Cassandra Nemzoff, Hiral Anil Shah
BMJ Evidence-Based Medicine.2025; : bmjebm-2023-112490. CrossRef - Wealth-based inequality in underweight among Scheduled Tribe women in India: a regional analysis
Anshika Singh, Aditya Singh, Mahashweta Chakrabarty, Shivani Singh, Pooja Tripathi
International Journal for Equity in Health.2025;[Epub] CrossRef - Assessing the Impact of Nutrition Workshops on Nutrition Knowledge, Attitudes, and Practices (KAP) in Uttarakhand
Sarah Armes, Reetu Sogani, Halima Jama, Ilakkiya Ezhilmaran, Harmanpreet Kaur, Wanja Nyaga, Ramya Rajaram, Debashis Chakraborty, Sucheta Mitra, Nitya Rao, Sumantra Ray
Food Science and Nutrition Cases.2025;[Epub] CrossRef - Economic evaluation of integrating nutritional support intervention in India’s National Tuberculosis Elimination Programme: implications for low-income and middle-income countries
Gaurav Jyani, Shankar Prinja, Sudheer Nadipally, Manjunath Shankar, Neeta Rao, Varsha Rao, Rajesh Ranjan Singh, Amar Shah, Yashika Chugh, Divya Monga, Atul Sharma, Ashutosh Aggarwal
BMJ Open.2025; 15(9): e098851. CrossRef - Variations in adult BMI among Indian men: a quantile regression analysis
Archana Agnihotri, Brinda Viswanathan
Journal of Biosocial Science.2024; 56(2): 251. CrossRef - Characteristics of individuals at risk of malnutrition in Thailand: an investigation focusing on income insecurity
Watchara Pechdin, Pongsun Bunditsakulchai
Frontiers in Sustainable Food Systems.2024;[Epub] CrossRef - A review on usefulness of millets in current prospects
Shivam Dubey
IP Journal of Nutrition, Metabolism and Health Science.2024; 6(4): 157. CrossRef - Millet production, challenges, and opportunities in the Asia-pacific region: a comprehensive review
M. S. Harish, Axay Bhuker, Bhagirath Singh Chauhan
Frontiers in Sustainable Food Systems.2024;[Epub] CrossRef - Temporal change in prevalence of BMI categories in India: patterns across States and Union territories of India, 1999–2021
Meekang Sung, Akhil Kumar, Raman Mishra, Bharati Kulkarni, Rockli Kim, S. V. Subramanian
BMC Public Health.2024;[Epub] CrossRef - Comparing Mid-Upper Arm Circumference With Body Mass Index for Assessing Nutritional Status in Indian Adults: Evidence From the National Family Health Survey 2015-16 (NFHS-4)
Shailender Negi, Nagapurkar Srinath, Mykala Akshay
Cureus.2024;[Epub] CrossRef - Machine learning prediction of nutritional status among pregnant women in Bangladesh: Evidence from Bangladesh demographic and health survey 2017–18
Najma Begum, Mohd. Muzibur Rahman, Mohammad Omar Faruk, Benojir Ahammed
PLOS ONE.2024; 19(5): e0304389. CrossRef - Sleep quality mediates the association between chronotype and mental health in young Indian adults
Satyam Chauhan, Rakesh Pandey, Krupa Vakani, Ray Norbury, Ulrich Ettinger, Veena Kumari
npj Mental Health Research.2024;[Epub] CrossRef - Comparison of bone health among pre-menopausal and post-menopausal females in rural Eastern India: A pilot study
Vishal Kumar, Sitanshu Barik, Kusum Kumari, Richa Richa, Vikash Raj, Mamta Shukla, Aman Kumar, Rajesh Kumar
Post Reproductive Health.2024; 30(4): 215. CrossRef - Prevalence and Correlates of Double and Triple Burden of Malnutrition Among Children and Adolescents in India: The Comprehensive National Nutrition Survey
Naiwen Ji, Abhishek Kumar, William Joe, Rebecca Kuriyan, Vani Sethi, Julia L Finkelstein, Saurabh Mehta
The Journal of Nutrition.2024; 154(10): 2932. CrossRef - The Indian Society of Critical Care Medicine Position Statement on the Management of Sepsis in Resource-limited Settings
Deven Juneja, Manish Munjal, Mohan Maharaj, Yash Javeri, Sheila N Myatra, Sivakumar M Nandakumar, Amol T Kothekar, Anand Nikalje, Anusha Cherian, Rakesh Nongthombam, Mahesh K Sinha
Indian Journal of Critical Care Medicine.2024; 28(S2): S4. CrossRef - Dietary Macronutrient and Micronutrient Intake Among Corporate Employees Aged 30 to 40 Years Residing in Mumbai, India
Meghna S. Motwani, Kasturi V. Deorukhkar, Neha Sanwalka, Nikita S. Kochrekar, Akshay Pai, Anuradha Mitra, Subhadra Mandalika
Current Research in Nutrition and Food Science Journal.2024; 12(2): 705. CrossRef - A cross-sectional study to estimate the prevalence of eating disorders and ascertain factors for eating disorder risk among senior college students in a metropolitan city
Rujuta S. Hadaye, S Rahini
Journal of Education and Health Promotion.2024;[Epub] CrossRef - Patterns of change in the association between socioeconomic status and body mass index distribution in India, 1999–2021
Meekang Sung, Anoop Jain, Akhil Kumar, Rockli Kim, Bharati Kulkarni, S V Subramanian
Journal of Global Health.2024;[Epub] CrossRef - Tobacco Use, Food Insecurity, and Low BMI in India’s Older Population
Yesuvadian Selvamani, Jalandhar Pradhan, Joelle H. Fong
Nutrients.2024; 16(21): 3649. CrossRef - Decomposing the gap in undernutrition among under-five children between EAG and non-EAG states of India
Sourav Chowdhury, Nuruzzaman Kasemi, Aditya Singh, Mahashweta Chakrabarty, Shivani Singh
Children and Youth Services Review.2023; 145: 106796. CrossRef - Randomized Controlled Trial Comparing Ferrous Sulfate and Iron Sucrose in Iron Deficiency Anemia in Pregnancy
Neha Chauhan, Poojan Dogra, Reena Sharma, Shashi Kant, Mridul Soni
Cureus.2023;[Epub] CrossRef - Maternal nutritional status and milk volume and composition in India: an observational study
Melissa F. Young, Emily C. Faerber, Rukshan V. Mehta, Samriddhi Ranjan, Sweekruthi A. Shetty, Usha Ramakrishnan, Kannan Rangiah, Beena Bose, Sarita Devi, Pratibha Dwarkanath, Anura V. Kurpad, Sunita Taneja, Reynaldo Martorell
The American Journal of Clinical Nutrition.2023; 117(4): 830. CrossRef - Yield improvement compensates the grain nutrient concentration in finger millet (Eleusine coracana L.): analysis using varieties released over years
K. C. Megha, Y. A. Nanja Reddy, D. C. Hanumanthappa
Plant Physiology Reports.2023; 28(2): 199. CrossRef - Burden of tuberculosis & malaria among tribal populations & implications for disease elimination in India
Jai Prakash Narain, Amar N. Shah, Rajesh Bhatia
Indian Journal of Medical Research.2023; 157(2&3): 163. CrossRef - Assessment of thinness based on BMI and MUAC among the adult Jaunsari
Koel Mukherjee, Pulamaghatta N. Venugopal, Kaustav Das
Human Biology and Public Health.2023;[Epub] CrossRef - Concurrent Undernutrition and Overnutrition within Indian Families between 2006 and 2021
Laxmi Kant Dwivedi, Parul Puri, Anjali Pant, Alka Chauhan, Samuel Scott, Shrikant Singh, Sarang Pedgaonker, Phuong H. Nguyen
Current Developments in Nutrition.2023; 7(9): 101987. CrossRef - Rural-urban disparities in nutritional status among women in Ethiopia based on HIV serostatus: a cross-sectional study using demographic and health survey data
Hirut Abebe, Anette Agardh, Malachi Ochieng Arunda
BMC Infectious Diseases.2023;[Epub] CrossRef - Evaluation of a results-based financing nutrition intervention for tuberculosis patients in Madhya Pradesh, India, implemented during the COVID-19 pandemic
Embry Howell, Rama Rao Dammala, Pratibha Pandey, Darcy Strouse, Atul Sharma, Neeta Rao, Sudheer Nadipally, Amar Shah, Varsha Rai, Russell Dowling
BMC Global and Public Health.2023;[Epub] CrossRef - Not Hungry, but Still Snacking: The Association Between Hedonic Hunger and Snacking Behaviour Among Young Adults in Vadodara, Gujarat
Margi Mankad, Devaki Gokhale
Cureus.2023;[Epub] CrossRef - Inequalities in the prevalence of double burden of malnutrition among mother–child dyads in India
Saurabh Singh, Neha Shri, Akancha Singh
Scientific Reports.2023;[Epub] CrossRef - Impact and Cost-Effectiveness Evaluation of Nutritional Supplementation and Complementary Interventions for Tuberculosis Treatment Outcomes under Mukti Pay-for-Performance Model in Madhya Pradesh, India: A Study Protocol
Shankar Prinja, Atul Sharma, Sudheer Nadipally, Saroj Kumar Rana, Pankaj Bahuguna, Neeta Rao, Gautam Chakraborty, Manjunath Shankar, Varsha Rai
The International Journal of Mycobacteriology.2023; 12(1): 82. CrossRef - Imperatives of recognising the complexities: gendered impacts and responses to COVID-19 in India
Bina Agarwal
Economia Politica.2022; 39(1): 31. CrossRef - Household Levels of Double Burden of Malnutrition in Low–Middle-income Countries: A Review
A. Bose, N. Mondal, J. Sen
Journal of the Anthropological Survey of India.2022; 71(1): 125. CrossRef - Mustard oil and cardiovascular health: Why the controversy?
Kavita H. Poddar, Geeta Sikand, Dinesh Kalra, Nathan Wong, P. Barton Duell
Journal of Clinical Lipidology.2022; 16(1): 13. CrossRef - Nutritional Supplementation Would Be Cost-Effective for Reducing Tuberculosis Incidence and Mortality in India: The Ration Optimization to Impede Tuberculosis (ROTI-TB) Model
Pranay Sinha, Subitha L Lakshminarayanan, Chelsie Cintron, Prakash Babu Narasimhan, Lindsey M Locks, Nalin Kulatilaka, Kimberly Maloomian, Senbagavalli Prakash Babu, Madeline E Carwile, Anne F Liu, C Robert Horsburgh, Carlos Acuna-Villaorduna, Benjamin P
Clinical Infectious Diseases.2022; 75(4): 577. CrossRef - Modern Processing of Indian Millets: A Perspective on Changes in Nutritional Properties
N. A. Nanje Gowda, Kaliramesh Siliveru, P. V. Vara Prasad, Yogita Bhatt, B. P. Netravati, Chennappa Gurikar
Foods.2022; 11(4): 499. CrossRef - Untangling the Web of Malnutrition, Sarcopenia, and Frailty in Chronic Liver Disease
Vivek A. Saraswat, Karan Kumar
Journal of Clinical and Experimental Hepatology.2022; 12(2): 268. CrossRef - Does maternal overnutrition carry child undernutrition in India?
Mukesh Kumar, Pratap Mohanty, Linglin Xie
PLOS ONE.2022; 17(6): e0265788. CrossRef - Double burden of malnutrition in Nepal: A trend analysis of protein-energy malnutrition and High Body Mass Index using the data from Global Burden of Disease 2010–2019
Priza Pradhananga, Archana Shrestha, Nabin Adhikari, Namuna Shrestha, Mukesh Adhikari, Nicole Ide, Saurya Dhungel, Swornim Bajracharya, Anu Aryal, Pranil Man Singh Pradhan
PLOS ONE.2022; 17(9): e0273485. CrossRef - Nutrition in the prevention and management of sarcopenia - A special focus on Asian Indians
Shinjini Bhattacharya, Rohini Bhadra, Annemie M.W.J. Schols, Ardy van Helvoort, Sucharita Sambashivaiah
Osteoporosis and Sarcopenia.2022; 8(4): 135. CrossRef - Chronic Energy Deficiency and Its Determinant Factors among Adults Aged 18–59 Years in Ethiopia: A Cross-Sectional Study
Samuel Dagne, Yonatan Menber, Yosef Wassihun, Gedefaw Dires, Atitegeb Abera, Seteamlak Adane, Melese Linger, Zelalem T. Haile, Roxana Valdés-Ramos
Journal of Nutrition and Metabolism.2021; 2021: 1. CrossRef - The double burden of malnutrition in India: Trends and inequalities (2006–2016)
Phuong Hong Nguyen, Samuel Scott, Derek Headey, Nishmeet Singh, Lan Mai Tran, Purnima Menon, Marie T. Ruel, Srinivas Goli
PLOS ONE.2021; 16(2): e0247856. CrossRef - Double burden of underweight and overweight among Indian adults: spatial patterns and social determinants
Pravat Bhandari, Ezra Gayawan, Suryakant Yadav
Public Health Nutrition.2021; 24(10): 2808. CrossRef - Screening of cardiovascular risk assessment accuracy of anthropometric indices in Indian children and adolescents
Mohit Aggarwal, Shailendra Singh, Anubhuti Bansal, Bapu Koundinya Desiraju, Anurag Agrawal
Wellcome Open Research.2021; 5: 273. CrossRef - Assessment of Sarcopenia in Chronic Liver Disease: Indian Perspective
Abhinav Anand, Anoop Saraya
Clinical Liver Disease.2021; 18(3): 164. CrossRef - ‘Bhavishya Shakti: Empowering the Future’: establishing and evaluating a pilot community mobile teaching kitchen as an innovative model, training marginalised women to become nutrition champions and culinary health educators in Kolkata, India
Luke Buckner, Harrison Carter, Dominic Crocombe, Sento Kargbo, Maria Korre, Somnath Bhar, Shivani Bhat, Debashis Chakraborty, Pauline Douglas, Mitali Gupta, Sudeshna Maitra-Nag, Sagarika Muhkerjee, Aparjita Saha, Minha Rajput-Ray, Ianthi Tsimpli, Sumantra
BMJ Nutrition, Prevention & Health.2021; 4(2): 405. CrossRef - Prevalence and determinants of double burden of malnutrition in Bangladesh: evidence from a nationwide cross-sectional survey
Md. Ashfikur Rahman, Henry Ratul Halder, Tanjim Siddiquee, Syeda Afia Farjana, Harun Or Roshid, Bayezid Khan, Nuzhat Fatema, Md. Hasan Howlader, Shaharior Rahman Razu
Nutrire.2021;[Epub] CrossRef - Tuberculosis—Learning the Impact of Nutrition (TB LION): protocol for an interventional study to decrease TB risk in household contacts
Chelsie Cintron, Prakash Babu Narasimhan, Lindsey Locks, Senbagavalli Babu, Pranay Sinha, Nonika Rajkumari, Vaishnavi Kaipilyawar, Anurag Bhargava, Kimberly Maloomian, Padma Chandrasekaran, Sheetal Verma, Noyal Joseph, W. Evan Johnson, Christine Wanke, C.
BMC Infectious Diseases.2021;[Epub] CrossRef - An Epidemiological Study for Assessment of Selected Lifestyle Disorders among University Students at Central Gujarat, India
Geetika Madan Patel, Dhara I Zalavadiya, Ankita Parmar
Healthline.2021; 12(2): 21. CrossRef - The dramatic rise in the prevalence of overweight and obesity in India: Obesity transition and the looming health care crisis
Zakaria Siddiqui, Ronald Donato
World Development.2020; 134: 105050. CrossRef - Factors associated with double burden of malnutrition among mother-child pairs in India: A study based on National Family Health Survey 2015–16
Ratna Patel, Shobhit Srivastava, Pradeep Kumar, Shekhar Chauhan
Children and Youth Services Review.2020; 116: 105256. CrossRef - Intra-Individual Double Burden of Malnutrition among Adults in China: Evidence from the China Health and Nutrition Survey 2015
Qiumin Huang, Liusen Wang, Hongru Jiang, Huijun Wang, Bing Zhang, Jiguo Zhang, Xiaofang Jia, Zhihong Wang
Nutrients.2020; 12(9): 2811. CrossRef - Screening of cardiovascular risk assessment accuracy of anthropometric indices in Indian children and adolescents
Mohit Aggarwal, Shailendra Singh, Anubhuti Bansal, Bapu Koundinya Desiraju, Anurag Agrawal
Wellcome Open Research.2020; 5: 273. CrossRef
 PubReader
 ePub Link
 Cite
Cite

Figure 1.
Figure 2.
Figure 3.
| Characteristics |
Men, % |
Women, % |
||||
|---|---|---|---|---|---|---|
| Underweight | Overweight/obesity | Total (n) | Underweight | Overweight/ obesity | Total (n) | |
| Age (yr) |
||||||
| 15-19 | 44.9 | 4.8 | 18,493 | 42.0 | 4.3 | 117,924 |
| 20-34 | 16.6 | 17.7 | 45,927 | 22.8 | 17.9 | 294,396 |
| 35-49 | 12.3 | 27.6 | 35,990 | 14.0 | 32.2 | 233,942 |
| Region |
||||||
| Northern | 16.5 | 19.5 | 22,161 | 19.4 | 22.2 | 129,946 |
| Central | 26.4 | 11.9 | 25,446 | 26.4 | 15.4 | 170,828 |
| Eastern | 22.2 | 13.8 | 15,433 | 26.7 | 15.4 | 116,030 |
| Western | 21.3 | 22.3 | 10,901 | 24.7 | 23.7 | 52,276 |
| Northeastern | 18.2 | 14.0 | 12,922 | 22.0 | 14.7 | 91,146 |
| Southern | 14.2 | 27.5 | 13,547 | 17.0 | 29.7 | 86,036 |
| Place of residence |
||||||
| Rural | 23.0 | 14.3 | 69,022 | 26.8 | 15.1 | 456,728 |
| Urban | 15.5 | 26.6 | 31,388 | 15.5 | 31.4 | 189,534 |
| Caste |
||||||
| SC | 22.9 | 15.0 | 17,963 | 25.3 | 17.3 | 114,935 |
| ST | 25.1 | 9.8 | 17,887 | 31.8 | 10.1 | 116,898 |
| OBC | 20.3 | 19.6 | 39,059 | 23.0 | 20.9 | 253,061 |
| Other | 16.6 | 24.7 | 19,919 | 17.8 | 27.4 | 131,157 |
| Religion |
||||||
| Hindu | 20.7 | 18.4 | 74,920 | 23.6 | 19.9 | 480,743 |
| Muslim | 19.3 | 19.9 | 13,886 | 21.6 | 23.7 | 86,135 |
| Other | 13.9 | 24.5 | 11,604 | 16.4 | 26.5 | 79,384 |
| Currently employed |
||||||
| No | 32.8 | 11.1 | 25,772 | 22.7 | 22.2 | 85,597 |
| Yes | 16.1 | 21.5 | 74,638 | 22.7 | 20.6 | 27,239 |
| Marital status |
||||||
| Never married | 30.7 | 10.2 | 38,688 | 37.4 | 6.6 | 167,696 |
| Married | 13.6 | 24.5 | 60,458 | 18.4 | 25.2 | 450,995 |
| Widowed | 24.2 | 13.5 | 577 | 18.1 | 26.5 | 20,000 |
| Divorced/separated | 22.3 | 15.4 | 687 | 20.2 | 22.7 | 7,571 |
| Education level |
||||||
| Not educated | 22.6 | 12.0 | 12,251 | 24.7 | 16.9 | 183,128 |
| Up to primary | 21.7 | 16.4 | 12,335 | 22.0 | 21.8 | 81,509 |
| Up to secondary | 22.3 | 18.0 | 59,890 | 24.0 | 21.4 | 308,908 |
| More than secondary | 10.4 | 28.5 | 15,934 | 16.0 | 25.9 | 72,717 |
| Wealth index |
||||||
| Poorest | 31.9 | 4.8 | 16,639 | 36.0 | 5.9 | 121,389 |
| Poorer | 26.6 | 9.8 | 21,039 | 29.6 | 11.4 | 137,673 |
| Middle | 20.5 | 16.6 | 21,970 | 23.1 | 18.8 | 136,665 |
| Richer | 16.2 | 24.4 | 20,798 | 17.1 | 28.2 | 129,062 |
| Richest | 10.6 | 32.7 | 19,964 | 11.6 | 36.2 | 121,473 |
| Tobacco use |
||||||
| No tobacco | 20.9 | 21.0 | 51,663 | 22.5 | 21.2 | 577,413 |
| Only smoking tobacco | 16.6 | 19.2 | 15,473 | 31.9 | 12.2 | 5,462 |
| Only smokeless tobacco | 20.8 | 15.7 | 22,335 | 28.4 | 15.0 | 60,988 |
| Both smoking and smokeless tobacco | 20.1 | 13.2 | 10,939 | 26.1 | 13.0 | 2,399 |
| Food consumption |
Men, % |
Women, % |
||||
|---|---|---|---|---|---|---|
| Underweight | Overweight/ obesity | Total (n) | Underweight | Overweight/ obesity | Total (n) | |
| Milk/curd |
||||||
| Never | 26.3 | 12.8 | 6,045 | 27.7 | 17.8 | 55,707 |
| Occasionally | 22.6 | 16.0 | 51,468 | 25.9 | 17.2 | 332,412 |
| Daily | 17.0 | 22.7 | 42,897 | 19.0 | 25.0 | 258,143 |
| Pulses |
||||||
| Never | 21.7 | 14.6 | 456 | 28.9 | 19.9 | 3,586 |
| Occasionally | 21.2 | 17.9 | 55,127 | 23.7 | 19.9 | 367,030 |
| Daily | 19.0 | 20.1 | 44,827 | 21.9 | 21.8 | 275,646 |
| Vegetables |
||||||
| Never | 25.6 | 12.9 | 418 | 30.6 | 16.8 | 2,117 |
| Occasionally | 21.5 | 18.0 | 52,730 | 23.9 | 20.0 | 326,903 |
| Daily | 18.6 | 20.1 | 47,262 | 21.8 | 21.7 | 317,242 |
| Fruits |
||||||
| Never | 26.9 | 9.9 | 2015 | 30.1 | 14.0 | 15,451 |
| Occasionally | 20.8 | 18.0 | 88,024 | 23.9 | 19.4 | 563,351 |
| Daily | 14.2 | 28.4 | 10,371 | 14.5 | 31.8 | 67,460 |
| Eggs |
||||||
| Never | 21.4 | 18.7 | 20,378 | 23.2 | 20.8 | 19,825 |
| Occasionally | 20.1 | 18.6 | 75,671 | 23.1 | 20.3 | 429,937 |
| Daily | 16.5 | 24.3 | 4,361 | 17.7 | 27.7 | 20,500 |
| Fish |
||||||
| Never | 21.2 | 18.3 | 28,481 | 23.3 | 20.5 | 233,755 |
| Occasionally | 20.2 | 18.9 | 67,796 | 23.5 | 20.3 | 385,262 |
| Daily | 13.6 | 23.4 | 433 | 14.6 | 27.6 | 27,245 |
| Chicken |
||||||
| Never | 21.2 | 18.3 | 23 521 | 23.1 | 20.6 | 211,694 |
| Occasionally | 19.9 | 19.1 | 75 153 | 23.0 | 20.7 | 426,757 |
| Daily | 18.8 | 21.0 | 1736 | 17.7 | 28.0 | 7,811 |
| Fried food |
||||||
| Never | 19.5 | 20.2 | 7,659 | 22.1 | 24.1 | 29,181 |
| Occasionally | 20.3 | 18.9 | 81,140 | 23.1 | 20.5 | 540,818 |
| Daily | 19.8 | 18.1 | 11,611 | 21.7 | 21.0 | 76,263 |
| Aerated drinks |
||||||
| Never | 21.0 | 16.2 | 12,549 | 25.9 | 17.8 | 106,120 |
| Occasionally | 20.3 | 19.0 | 81,401 | 22.5 | 21.3 | 509,147 |
| Daily | 17.2 | 22.8 | 6,460 | 20.3 | 22.3 | 30,995 |
| Characteristics | Men |
Women |
||
|---|---|---|---|---|
| Underweight | Overweight/obesity | Underweight | Overweight/obesity | |
| Age (yr) | ||||
| 15-19 | 1.00 (reference) | 1.00 (reference) | 1.00 (reference) | 1.00 (reference) |
| 20-34 | 0.40 (0.38, 0.42) |
2.14 (1.95, 2.34) |
0.68 (0.65, 0.72) |
2.30 (2.10, 2.53) |
| 35-49 | 0.34 (0.32, 0.37) |
3.15 (2.85, 3.48) |
0.44 (0.41, 0.47) |
4.52 (4.11, 4.98) |
| Region | ||||
| Northern | 1.00 (reference) | 1.00 (reference) | 1.00 (reference) | 1.00 (reference) |
| Central | 1.32 (1.25, 1.40) |
0.89 (0.83, 0.94) |
1.08 (1.02, 1.13) |
0.99 (0.93, 1.04) |
| Eastern | 1.04 (0.98, 1.11) | 1.17 (1.09, 1.26) |
1.15 (1.09, 1.22) |
1.06 (0.98, 1.13) |
| Western | 1.58 (1.48, 1.70) |
1.22 (1.14, 1.31) |
1.62 (1.52, 1.72) |
1.14 (1.07, 1.22) |
| Northeastern | 0.65 (0.60, 0.71) |
1.29 (1.19, 1.40) |
0.60 (0.55, 0.65) |
1.06 (0.98, 1.15) |
| Southern | 0.98 (0.91, 1.05) | 1.57 (1.47, 1.68) |
1.07 (1.00, 1.14) |
1.44 (1.36, 1.54) |
| Place of residence | ||||
| Rural | 1.00 (reference) | 1.00 (reference) | 1.00 (reference) | 1.00 (reference) |
| Urban | 1.01 (0.96, 1.05) | 1.18 (1.13, 1.23) |
0.89 (0.85, 0.93) |
1.28 (1.23, 1.33) |
| Caste | ||||
| SC | 1.00 (reference) | 1.00 (reference) | 1.00 (reference) | 1.00 (reference) |
| ST | 0.79 (0.75, 0.84) |
0.83 (0.77, 0.90) |
0.974 (0.92, 1.03) | 0.76 (0.71, 0.81) |
| OBC | 0.97 (0.92, 1.01) | 1.07 (1.01, 1.13) |
0.967 (0.93, 1.01) | 1.02 (0.97, 1.07) |
| Other | 0.87 (0.82, 0.92) |
1.22 (1.15, 1.30) |
0.88 (0.83, 0.93) |
1.13 (1.07, 1.20) |
| Religion | ||||
| Hindu | 1.00 (reference) | 1.00 (reference) | 1.00 (reference) | 1.00 (reference) |
| Muslim | 0.93 (0.88, 0.99) |
0.99 (0.93, 1.06) | 0.91 (0.86, 0.96) |
1.29 (1.22, 1.37) |
| Other | 0.69 (0.63, 0.74) |
1.15 (1.07, 1.23) |
0.60 (0.56, 0.64) |
1.09 (1.02,1.16) |
| Currently employed | ||||
| No | 1.00 (reference) | 1.00 (reference) | 1.00 (reference) | 1.00 (reference) |
| Yes | 0.72 (0.69, 0.75) |
1.00 (0.94, 1.06) | 0.96 (0.93, 1.00) |
0.93 (0.89, 0.97) |
| Marital status | ||||
| Never married | 1.00 (reference) | 1.00 (reference) | 1.00 (reference) | 1.00 (reference) |
| Married | 0.76 (0.72, 0.80) |
1.91 (1.80, 2.02) |
0.64 (0.61, 0.67) |
2.19 (2.05, 2.34) |
| Widowed | 1.14 (0.92, 1.41) | 1.34 (1.02, 1.78) |
0.69 (0.62, 0.77) |
2.00 (1.79, 2.23) |
| Divorced/separated | 1.06 (0.86, 1.31) | 1.31 (1.03, 1.66) |
0.83 (0.72, 0.96) |
1.90 (1.62, 2.23) |
| Education level | ||||
| Not educated | 1.00 (reference) | 1.00 (reference) | 1.00 (reference) | 1.00 (reference) |
| Up to primary | 1.03 (0.97, 1.11) | 1.20 (1.10, 1.30) |
0.89 (0.84, 0.94) |
1.15 (1.09, 1.22) |
| Up to secondary | 0.87 (0.83, 0.93) |
1.23 (1.15, 1.32) |
0.86 (0.82, 0.90) |
1.19 (1.13, 1.25) |
| More than secondary | 0.59 (0.54, 0.64) |
1.38 (1.27, 1.50) |
0.71 (0.66, 0.76) |
1.04 (0.97, 1.12) |
| Wealth index | ||||
| Poorest | 1.00 (reference) | 1.00 (reference) | 1.00 (reference) | 1.00 (reference) |
| Poorer | 0.85 (0.80, 0.89) |
1.61 (1.47, 1.76) |
0.84 (0.81, 0.89) |
1.75 (1.62, 1.90) |
| Middle | 0.68 (0.65, 0.72) |
2.49 (2.27, 2.72) |
0.73 (0.69, 0.76) |
2.76 (2.55, 2.99) |
| Richer | 0.59 (0.56, 0.64) |
3.69 (3.37, 4.04) |
0.60 (0.57, 0.64) |
4.33 (3.99, 4.71) |
| Richest | 0.43 (0.40, 0.47) |
5.10 (4.63, 5.62) |
0.47 (0.44, 0.51) |
5.63 (5.15, 6.15) |
| Tobacco | ||||
| No tobacco | 1.00 (reference) | 1.00 (reference) | 1.00 (reference) | 1.00 (reference) |
| Only smoking tobacco | 1.09 (1.03, 1.15) |
0.78 (0.74, 0.83) |
1.49 (1.25, 1.77) |
1.02 (0.83, 1.25) |
| Only smokeless tobacco | 1.05 (1.00, 1.10) |
0.85 (0.81, 0.89) |
1.37 (1.30, 1.45) |
0.88 (0.83, 0.95) |
| Both smoking and smokeless tobacco | 1.04 (0.98, 1.11) | 0.73 (0.68, 0.78) |
1.06 (0.77, 1.45) | 0.80 (0.61, 1.05) |
| Food consumption | Men |
Women |
||
|---|---|---|---|---|
| Underweight | Overweight/obesity | Underweight | Overweight/obesity | |
| Milk/curd | ||||
| Never | 1.00 (reference) | 1.00 (reference) | 1.00 (reference) | 1.00 (reference) |
| Occasionally | 0.82 (0.76, 0.88) |
0.94 (0.86, 1.03) | 1.02 (0.96, 1.08) | 0.97 (0.91, 1.04) |
| Daily | 0.75 (0.69, 0.81) |
0.99 (0.90, 1.08) | 0.92 (0.86, 0.98) |
0.94 (0.88, 1.01) |
| Pulses | ||||
| Never | 1.00 (reference) | 1.00 (reference) | 1.00 (reference) | 1.00 (reference) |
| Occasionally | 1.03 (0.80, 1.34) | 1.17 (0.85, 1.61) | 1.04 (0.83, 1.29) | 0.72 (0.57, 0.92) |
| Daily | 1.05 (0.81, 1.36) | 1.24 (0.90, 1.71) | 1.02 (0.82, 1.27) | 0.73 (0.57, 0.94) |
| Vegetables | ||||
| Never | 1.00 (reference) | 1.00 (reference) | 1.00 (reference) | 1.00 (reference) |
| Occasionally | 0.90 (0.71, 1.14) | 1.08 (0.78, 1.51) | 0.76 (0.59, 0.98) |
0.94 (0.68, 1.30) |
| Daily | 0.85 (0.67, 1.08) | 1.14 (0.82, 1.59) | 0.73 (0.57, 0.94) |
1.05 (0.76, 1.45) |
| Fruits | ||||
| Never | 1.00 (reference) | 1.00 (reference) | 1.00 (reference) | 1.00 (reference) |
| Occasionally | 1.02 (0.91, 1.14) | 1.10 (0.93, 1.29) | 0.91 (0.82, 1.00) |
1.01 (0.88, 1.16) |
| Daily | 1.01 (0.89, 1.15) | 1.25 (1.05, 1.49) |
0.82 (0.73, 0.92) |
1.13 (0.98, 1.31) |
| Eggs | ||||
| Never | 1.00 (reference) | 1.00 (reference) | 1.00 (reference) | 1.00 (reference) |
| Occasionally | 0.92 (0.86, 0.98) |
0.93 (0.86, 1.01) |
0.98 (0.92, 1.04) | 0.89 (0.83, 0.96) |
| Daily | 1.02 (0.91, 1.15) | 1.02 (0.91, 1.15) | 1.16 (1.03, 1.30) |
1.00 (0.90, 1.12) |
| Fish | ||||
| Never | 1.00 (reference) | 1.00 (reference) | 1.00 (reference) | 1.00 (reference) |
| Occasionally | 1.02 (0.96, 1.09) | 1.10 (1.02, 1.19) |
0.98 (0.92, 1.04) | 1.07 (0.99, 1.15) |
| Daily | 0.84 (0.74, 0.96) |
1.04 (0.92, 1.17) | 0.78 (0.70, 0.87) |
1.08 (0.98, 1.20) |
| Chicken | ||||
| Never | 1.00 (reference) | 1.00 (reference) | 1.00 (reference) | 1.00 (reference) |
| Occasionally | 0.95 (0.88, 1.03) | 1.07 (0.98, 1.17) | 0.99 (0.92, 1.07) | 1.06 (0.98, 1.16) |
| Daily | 1.09 (0.91, 1.30) | 1.09 (0.92, 1.29) | 0.99 (0.83, 1.20) | 1.07 (0.90, 1.27) |
| Fried food | ||||
| Never | 1.00 (reference) | 1.00 (reference) | 1.00 (reference) | 1.00 (reference) |
| Occasionally | 1.00 (0.93, 1.07) | 0.96 (0.89, 1.03) | 1.06 (0.98, 1.15) | 0.86 (0.79, 0.94) |
| Daily | 1.01 (0.92, 1.10) | 0.93 (0.85, 1.02) | 1.03 (0.94, 1.14) | 0.89 (0.81, 0.98) |
| Aerated drinks | ||||
| Never | 1.00 (reference) | 1.00 (reference) | 1.00 (reference) | 1.00 (reference) |
| Occasionally | 0.98 (0.93, 1.04) | 1.15 (1.08, 1.22) |
0.90 (0.86, 0.94) |
1.11 (1.06, 1.17) |
| Daily | 0.89 (0.81, 0.98) |
1.18 (1.08, 1.30) |
0.91 (0.83, 1.00) |
1.07 (0.98, 1.18) |
NFHS, National Family Health Survey; SC, Scheduled Caste; ST, Scheduled Tribe; OBC, Other Backward Class. Significance level is obtained from chi-square test. p<0.001.
NFHS, National Family Health Survey. Significance level is obtained from chi-square test. p<0.001.
Values are presented as relative risk (95% confidence interval). NFHS, National Family Health Survey; SC, Scheduled Caste; ST, Scheduled Tribe; OBC, Other Backward Class. The results were adjusted for age, marital status, caste, religion, place of residence, schooling, wealth quintile, employment status, and tobacco use. p<0.01, p<0.001.
Values are presented as relative risk (95% confidence interval). NFHS, National Family Health Survey. The results were adjusted for age, marital status, caste, religion, place of residence, schooling, wealth quintile, employment status, and tobacco use. p<0.05, p<0.01, p<0.001.

