
Articles
- Page Path
- HOME > Epidemiol Health > Volume 45; 2023 > Article
-
Original Article
Non-linear relationship between body mass index and self-rated health in older Korean adults: body image and sex considerations -
Seok-Joon Yoon1*
 , Jin-Gyu Jung1*, Soon-Ki Ahn2, Jong-Sung Kim1, Jang-Hee Hong3
 -
Epidemiol Health 2023;45:e2023061.
DOI: https://doi.org/10.4178/epih.e2023061
Published online: June 20, 2023
1Department of Family Medicine, Chungnam National University Hospital, Daejeon, Korea
2Department of Preventive Medicine, Chungnam National University Hospital, Daejeon, Korea
3Clinical Trial Center, Biomedical Research Institute, Chungnam National University Hospital, Daejeon, Korea
- Correspondence: Soon-Ki Ahn Department of Preventive Medicine, Chungnam National University Hospital, 282 Munhwa-ro, Jung-gu, Daejeon 35015, Korea E-mail: withspirit09@gmail.com
- *Yoon & Jung contributed equally to this work as joint first authors.
© 2023, Korean Society of Epidemiology
This is an open-access article distributed under the terms of the Creative Commons Attribution License (http://creativecommons.org/licenses/by/4.0/), which permits unrestricted use, distribution, and reproduction in any medium, provided the original work is properly cited.

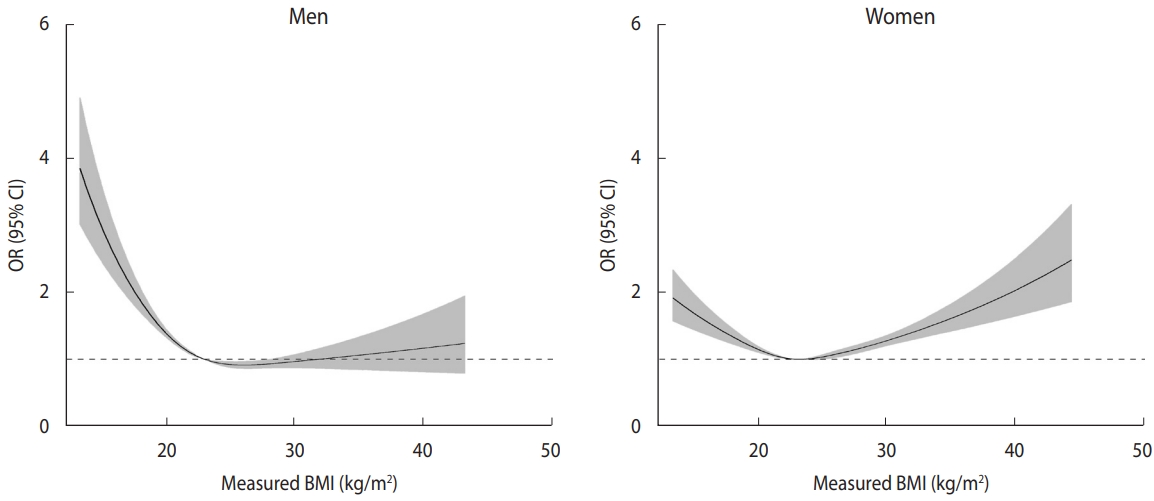


Figure & Data
References
Citations
- Nutritional Risk Factors Model of Community-Dwelling Older People in Poland–Pilot Study
Robert Gajda, Marzena Jeżewska-Zychowicz, Karolina Rak, Monika Maćków
Nutrients.2025; 17(13): 2150. CrossRef
 PubReader
 ePub Link
 Cite
Cite


Figure 1.
Figure 2.
Figure 3.
Graphical abstract
| Characteristics | Men |
Women |
|||||
|---|---|---|---|---|---|---|---|
| Not poor SRH (n=16,858) | Poor SRH (n=7,244) | p-value |
Not poor SRH (n=19,637) | Poor SRH (n=15,889) | p-value |
||
| Age, mean±SE (yr) | 72.8±0.0 | 75.0±0.1 | <0.001 | 73.1±0.1 | 75.4±0.1 | <0.001 | |
| BMI (kg/m2) | <0.001 | <0.001 | |||||
| <18.5 | 643 (56.7) | 666 (43.3) | 572 (49.4) | 763 (50.7) | |||
| 18.5-22.9 | 5723 (70.7) | 6435 (29.3) | 2760 (60.6) | 5109 (39.4) | |||
| 23.0-24.9 | 4690 (74.6) | 4821 (25.4) | 1761 (62.8) | 3342 (37.2) | |||
| 25.0-29.9 | 5397 (76.3) | 6783 (23.7) | 1957 (58.6) | 5495 (41.4) | |||
| ≥30.0 | 405 (69.3) | 932 (30.7) | 194 (46.8) | 1180 (53.2) | |||
| Self-perceived body image | <0.001 | <0.001 | |||||
| Much too thin | 871 (46.2) | 1,122 (53.8) | 1,183 (37.9) | 2,116 (62.1) | |||
| A bit thin | 3,316 (68.0) | 1,828 (32.0) | 3,142 (52.1) | 3,377 (48.0) | |||
| Exactly the right weight | 8,857 (78.5) | 2,704 (21.5) | 9,519 (67.2) | 5,530 (32.8) | |||
| A bit fat | 3,586 (74.9) | 1,352 (25.1) | 5,192 (59.2) | 4,015 (40.8) | |||
| Much too fat | 228 (51.4) | 238 (48.6) | 601 (43.5) | 851 (56.5) | |||
| Education | <0.001 | <0.001 | |||||
| None | 886 (56.4) | 754 (43.6) | 4,730 (44.1) | 6,162 (55.9) | |||
| Elementary school | 5,581 (65.1) | 3,141 (34.9) | 9,395 (57.0) | 7,390 (43.0) | |||
| Middle school | 3,673 (71.3) | 1,487 (28.8) | 2,650 (65.8) | 1,430 (34.2) | |||
| High school | 4,249 (78.4) | 1,308 (21.6) | 2,112 (75.4) | 724 (24.6) | |||
| College or over | 2,449 (82.2) | 547 (17.8) | 726 (81.9) | 169 (18.1) | |||
| Subjective stress | <0.001 | <0.001 | |||||
| Very much | 175 (42.1) | 298 (57.9) | 315 (32.3) | 836 (67.7) | |||
| Much | 1,376 (52.7) | 1,378 (47.3) | 2,232 (41.0) | 3,690 (59.0) | |||
| A little | 7,386 (75.5) | 2,914 (24.5) | 8,505 (61.7) | 6,408 (38.3) | |||
| None | 7,912 (77.7) | 2,634 (22.4) | 8,569 (67.6) | 4,901 (32.4) | |||
| Lifetime smoking | <0.001 | <0.001 | |||||
| Yes | 12,855 (71.9) | 5,794 (28.1) | 626 (45.6) | 799 (54.5) | |||
| No | 4,001 (76.2) | 1,450 (23.8) | 19,011 (59.8) | 15,090 (40.2) | |||
| Lifetime alcohol drinking | <0.001 | <0.001 | |||||
| Yes | 14,894 (73.4) | 6,257 (26.6) | 11,942 (61.4) | 8,847 (38.7) | |||
| No | 1,964 (68.7) | 987 (31.3) | 7,695 (55.8) | 7,042 (44.2) | |||
| Walking (day/wk) | <0.001 | <0.001 | |||||
| 0 | 3,251 (57.4) | 2,345 (42.6) | 3,462 (40.5) | 4,907 (59.5) | |||
| 1-3 | 2,918 (72.0) | 1,247 (28.0) | 4,051 (55.2) | 3,500 (44.9) | |||
| 4-6 | 3,219 (76.7) | 1,071 (23.3) | 4,235 (66.5) | 2,533 (33.5) | |||
| 7 | 7,460 (77.3) | 2,565 (22.7) | 7,857 (65.5) | 4,908 (34.5) | |||
| Marital status | <0.001 | <0.001 | |||||
| Married | 14,787 (73.8) | 6,103 (26.2) | 9,605 (62.2) | 6,901 (37.8) | |||
| Widowed | 1,307 (68.9) | 733 (31.1) | 9,426 (55.7) | 8,601 (44.3) | |||
| Divorced or separated | 693 (65.0) | 351 (35.0) | 502 (61.1) | 347 (38.9) | |||
| Never married | 63 (56.6) | 51 (43.4) | 92 (77.2) | 36 (22.8) | |||
| Depression | <0.001 | <0.001 | |||||
| Yes | 432 (41.3) | 653 (58.7) | 1,014 (38.0) | 1,898 (62.0) | |||
| No | 16,418 (74.7) | 6,586 (25.4) | 18,614 (61.5) | 13,966 (38.5) | |||
| Hypertension | <0.001 | <0.001 | |||||
| Yes | 8,052 (68.6) | 4,224 (31.4) | 10,593 (52.9) | 10,672 (47.1) | |||
| No | 8,804 (77.6) | 3,017 (22.4) | 9,037 (68.1) | 5,209 (31.9) | |||
| Diabetes mellitus | <0.001 | <0.001 | |||||
| Yes | 3,028 (61.8) | 2,111 (38.2) | 3,177 (45.8) | 4,142 (54.2) | |||
| No | 13,828 (76.1) | 5,128 (23.9) | 16,450 (63.0) | 11,738 (37.0) | |||
| Variables | Men |
Women |
|||||
|---|---|---|---|---|---|---|---|
| Crude | Model 1 | Model 2 | Crude | Model 1 | Model 2 | ||
| BMI (kg/m2) | |||||||
| <18.5 | 1.84 (1.54, 2.21) | 1.66 (1.36, 2.03) | 1.01 (0.81, 1.26) | 1.58 (1.33, 1.87) | 1.49 (1.24, 1.79) | 0.99 (0.81, 1.22) | |
| 18.5-22.9 | 1.00 (reference) | 1.00 (reference) | 1.00 (reference) | 1.00 (reference) | 1.00 (reference) | 1.00 (reference) | |
| 23.0-24.9 | 0.82 (0.74, 0.92) | 0.86 (0.76, 0.96) | 1.13 (0.99, 1.28) | 0.91 (0.84, 0.99) | 0.94 (0.86, 1.04) | 1.11 (1.01, 1.23) | |
| 25.0-29.9 | 0.75 (0.68, 0.83) | 0.73 (0.66, 0.82) | 0.87 (0.75, 1.01) | 1.09 (1.01, 1.17) | 1.01 (0.93, 1.10) | 1.10 (0.99, 1.22) | |
| ≥30.0 | 1.07 (0.82, 1.38) | 0.97 (0.73, 1.30) | 0.75 (0.53, 1.05) | 1.75 (1.53, 2.01) | 1.43 (1.24, 1.65) | 1.24 (1.04, 1.47) | |
| SBI | |||||||
| Much too thin | 4.26 (3.67, 4.94) | - | 3.42 (2.82, 4.14) | 3.35 (2.97, 3.76) | - | 2.60 (2.25, 3.01) | |
| A bit thin | 1.72 (1.55, 1.91) | - | 1.69 (1.49, 1.92) | 1.88 (1.73, 2.06) | - | 1.67 (1.50, 1.85) | |
| Exactly the right weight | 1.00 (reference) | - | 1.00 (reference) | 1.00 (reference) | - | 1.00 (reference) | |
| A bit fat | 1.22 (1.10, 1.36) | - | 1.37 (1.20, 1.56) | 1.41 (1.31, 1.52) | - | 1.39 (1.27, 1.53) | |
| Much too fat | 3.45 (2.63, 4.53) | - | 3.78 (2.74, 5.20) | 2.66 (2.27, 3.11) | - | 2.26 (1.88, 2.72) | |
Values are presented as number (weighted %). SRH, self-rated health; SE, standard error; BMI, body mass index. Not poor SRH means very good, good, or fair SRH; Poor SRH means bad or very bad SRH. By the complex-sample t-test or the complex-sample Rao-Scott chi-square test.
Values are presented as odds ratio (95% confidence interval) for poor SRH. BMI, body mass index; SBI, self-perceived body image; SRH, self-rated health. By survey logistic regression analyses. Model 1 was adjusted for age, education, subjective stress, lifetime smoking, lifetime alcohol drinking, exercise, marital status, depression, hypertension, and diabetes mellitus; Model 2: model 1+SBI.

