
Articles
- Page Path
- HOME > Epidemiol Health > Volume 46; 2024 > Article
-
Original Article
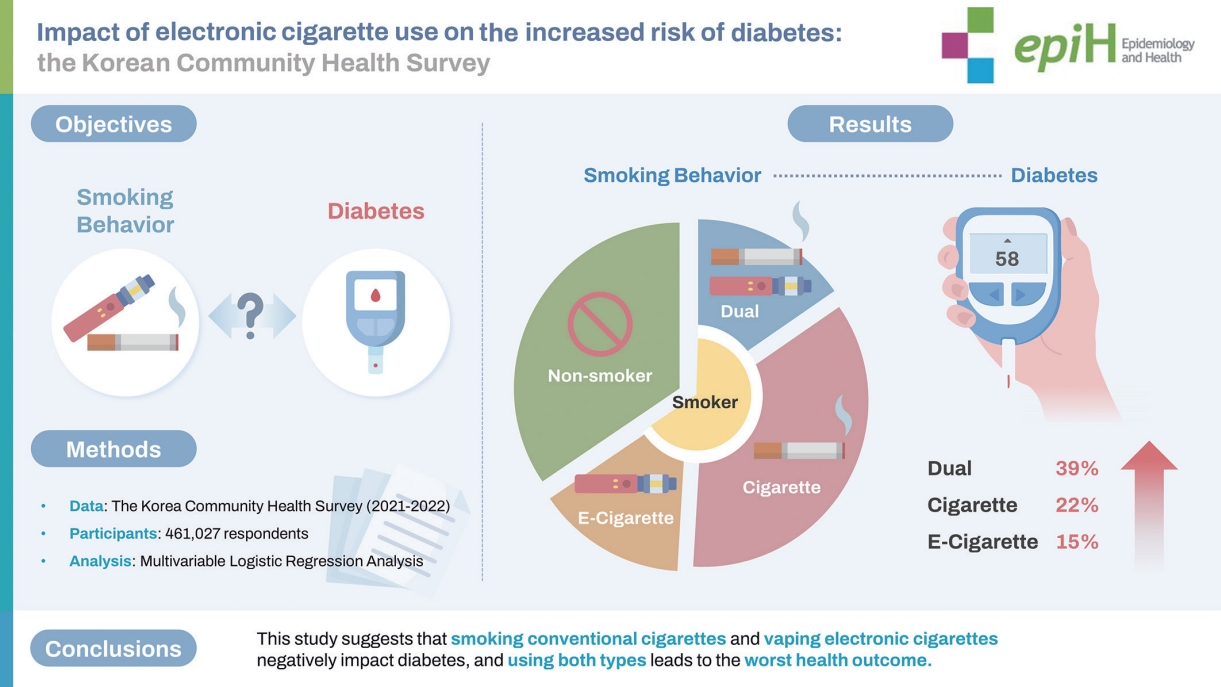
Impact of electronic cigarette use on the increased risk of diabetes: the Korean Community Health Survey -
Wonseok Jeong1
 , Seungju Kim2
 -
Epidemiol Health 2024;46:e2024029.
DOI: https://doi.org/10.4178/epih.e2024029
Published online: February 13, 2024
1Department of Public Health, Graduate School, Seoul National University, Seoul, Korea
2Department of Health System, College of Nursing, The Catholic University of Korea, Seoul, Korea
- Correspondence: Seungju Kim Department of Health System, College of Nursing, The Catholic University of Korea, 222 Banpo-daero, Seocho-gu, Seoul 06591, Korea E-mail: seungju.phd@gmail.com
• Received: December 5, 2023 • Accepted: January 24, 2024
© 2024, Korean Society of Epidemiology
This is an open-access article distributed under the terms of the Creative Commons Attribution License (http://creativecommons.org/licenses/by/4.0/), which permits unrestricted use, distribution, and reproduction in any medium, provided the original work is properly cited.

Figure & Data
References
Citations
Citations to this article as recorded by 
- Association Between Electronic Cigarette Use and Risk of Obstructive Sleep Apnea Among Korean Adults: A Cross-Sectional Nationwide Population-Based Study
Wonseok Jeong, Min Ji Song, Ji Hye Shin, Ji Hyun Kim
Journal of Clinical Medicine.2025; 14(11): 3616. CrossRef - Tobacco, electronic cigarette, alcohol and cannabis use among individuals diagnosed with diabetes. A national survey in France
Ivan Berlin, Romain Guignard, Sandrine Fosse-Edorh, Guillemette Quatremère, Emmanuel Lahaie, Viêt Nguyen-Thanh
Primary Care Diabetes.2025; 19(5): 478. CrossRef
 PubReader
 ePub Link
 Cite
CiteImpact of electronic cigarette use on the increased risk of diabetes: the Korean Community Health Survey
Graphical abstract
Graphical abstract
Impact of electronic cigarette use on the increased risk of diabetes: the Korean Community Health Survey
| Characteristics | Total | Diabetes |
p-value | |
|---|---|---|---|---|
| Yes | No | |||
| Total | 460,603 (100) | 59,320 (12.9) | 401,283 (87.1) | |
| Smoking behavior | <0.001 | |||
| Dual smoker | 4,787 (1.0) | 277 (5.8) | 4,510 (94.2) | |
| Conventional cigarette smoker | 70,063 (15.2) | 9,359 (13.4) | 60,704 (86.6) | |
| Electronic cigarette smoker | 5,027 (1.1) | 276 (5.5) | 4,751 (94.5) | |
| Non-smoker | 380,726 (82.7) | 49,408 (13.0) | 331,318 (87.0) | |
| Sex | <0.001 | |||
| Male | 210,427 (45.7) | 29,778 (14.2) | 180,649 (85.8) | |
| Female | 250,176 (54.3) | 29,542 (11.8) | 220,634 (88.2) | |
| Age (yr) | <0.001 | |||
| 19-39 | 97,968 (21.3) | 1,201 (1.2) | 96,767 (98.8) | |
| 40-59 | 156,204 (33.9) | 13,019 (8.3) | 143,185 (91.7) | |
| ≥60 | 206,431 (44.8) | 45,100 (21.8) | 161,331 (78.2) | |
| Educational level | <0.001 | |||
| Middle school or lower | 146,920 (31.9) | 32,607 (22.2) | 114,313 (77.8) | |
| High school | 133,654 (29.0) | 16,327 (12.2) | 117,327 (87.8) | |
| College or higher | 179,819 (39.0) | 10,352 (5.8) | 169,467 (94.2) | |
| Region | <0.001 | |||
| Urban area | 134,893 (29.3) | 15,395 (11.4) | 119,498 (88.6) | |
| Rural area | 325,710 (70.7) | 43,925 (13.5) | 281,785 (86.5) | |
| Alcohol consumption status | ||||
| Heavy consumption | 83,326 (18.1) | 8,850 (10.6) | 74,476 (89.4) | <0.001 |
| Moderate consumption | 187,750 (40.8) | 16,375 (8.7) | 171,375 (91.3) | |
| Light consumption | 189,527 (41.1) | 34,095 (18.0) | 155,432 (82.0) | |
| Occupational classification | <0.001 | |||
| White-collar | 95,027 (20.6) | 5,050 (5.3) | 89,977 (94.7) | |
| Blue-collar | 135,318 (29.4) | 19,690 (14.6) | 115,628 (85.4) | |
| Pink-collar | 58,500 (12.7) | 5,252 (9.0) | 53,248 (91.0) | |
| None | 171,758 (37.3) | 29,328 (17.1) | 142,430 (82.9) | |
| Self-reported health status | <0.001 | |||
| Good | 186,078 (40.4) | 11,325 (6.1) | 174,753 (93.9) | |
| Normal | 192,708 (41.8) | 25,290 (13.1) | 167,418 (86.9) | |
| Bad | 81,817 (17.8) | 22,705 (27.8) | 59,112 (72.2) | |
| Body mass index | <0.001 | |||
| Overweight | 250,126 (54.3) | 38,104 (15.2) | 212,022 (84.8) | |
| Normal | 210,477 (45.7) | 21,216 (10.1) | 189,261 (89.9) | |
| Regular exercise | <0.001 | |||
| Yes | 91,885 (19.9) | 9,572 (10.4) | 82,313 (89.6) | |
| No | 368,372 (80.0) | 49,690 (13.5) | 318,682 (86.5) | |
| Breakfast frequency (day/wk) | <0.001 | |||
| 5-7 | 305,951 (66.4) | 50,916 (16.6) | 255,035 (83.4) | |
| 1-4 | 62,596 (13.6) | 3,908 (6.2) | 58,688 (93.8) | |
| 0 | 92,056 (20.0) | 4,496 (4.9) | 87,560 (95.1) | |
| Year | <0.001 | |||
| 2021 | 229,007 (49.7) | 28,447 (12.4) | 200,560 (87.6) | |
| 2022 | 231,596 (50.3) | 30,873 (13.3) | 200,723 (86.7) | |
| Variables | Diabetes | p-value |
|---|---|---|
| Smoking behavior | ||
| Dual smoker | 1.39 (1.22, 1.58) | <0.001 |
| Conventional cigarette smoker | 1.22 (1.19, 1.26) | <0.001 |
| Electronic cigarette smoker | 1.15 (1.01, 1.31) | 0.032 |
| Non-smoker | 1.00 (reference) | |
| Sex | ||
| Male | 1.56 (1.53, 1.60) | <0.001 |
| Female | 1.00 (reference) | |
| Age (yr) | ||
| 19-39 | 0.10 (0.09, 0.10) | <0.001 |
| 40-59 | 0.52 (0.51, 0.53) | <0.001 |
| ≥60 | 1.00 (reference) | |
| Educational level | ||
| Middle school or lower | 1.28 (1.24, 1.32) | <0.001 |
| High school | 1.20 (1.16, 1.23) | <0.001 |
| College or higher | 1.00 (reference) | |
| Region | ||
| Urban area | 1.04 (1.02, 1.07) | <0.001 |
| Rural area | 1.00 (reference) | |
| Alcohol consumption status | ||
| Heavy consumption | 0.76 (0.74, 0.78) | <0.001 |
| Moderate consumption | 0.83 (0.81, 0.85) | <0.001 |
| Light consumption | 1.00 (reference) | |
| Occupational classification | ||
| White-collar | 0.84 (0.81, 0.87) | <0.001 |
| Blue-collar | 0.90 (0.88, 0.92) | <0.001 |
| Pink-collar | 0.93 (0.90, 0.97) | <0.001 |
| None | 1.00 (reference) | |
| Self-reported health status | ||
| Good | 0.28 (0.28, 0.29) | <0.001 |
| Normal | 0.55 (0.54, 0.57) | <0.001 |
| Bad | 1.00 (reference) | |
| Body mass index | ||
| Normal | 0.59 (0.57, 0.60) | <0.001 |
| Overweight | 1.00 (reference) | |
| Regular exercise | ||
| Yes | 0.97 (0.94, 0.99) | 0.010 |
| No | 1.00 (reference) | |
| Breakfast frequency (day/wk) | ||
| 5-7 | 1.59 (1.53, 1.64) | <0.001 |
| 1-4 | 1.12 (1.07, 1.18) | <0.001 |
| 0 | 1.00 (reference) |
| Variables | Dual smoker | Conventional cigarette smoker | Electronic cigarette smoker | Non-smoker |
|---|---|---|---|---|
| Age (yr) | ||||
| 19-39 | 1.42 (1.08, 1.88) | 1.46 (1.25, 1.70) |
1.13 (0.81, 1.60) | 1.00 (reference) |
| 40-59 | 1.34 (1.13, 1.58) | 1.24 (1.18, 1.30) |
1.17 (1.00, 1.38) |
1.00 (reference) |
| ≥60 | 1.59 (1.09, 2.32) | 1.14 (1.10, 1.18) |
1.29 (0.95, 1.75) | 1.00 (reference) |
| Sex | ||||
| Male | 1.30 (1.13, 1.48) | 1.16 (1.13, 1.20) |
1.03 (0.90, 1.18) | 1.00 (reference) |
| Female | 1.45 (0.90, 2.35) | 1.53 (1.41, 1.65) |
1.47 (1.00, 2.18) | 1.00 (reference) |
| Educational level | ||||
| Middle school or lower | 1.27 (0.77, 2.11) | 1.13 (1.08, 1.18) |
1.27 (0.73, 2.20) | 1.00 (reference) |
| High school | 1.17 (0.94, 1.45) | 1.13 (1.08, 1.19) |
1.02 (0.81, 1.28) | 1.00 (reference) |
| College or higher | 1.46 (1.23, 1.74) | 1.38 (1.30, 1.18) |
1.20 (1.02, 1.42) |
1.00 (reference) |
| Region | ||||
| Urban area | 1.56 (1.26, 1.93) | 1.26 (1.19, 1.33) |
1.12 (0.90, 1.39) | 1.00 (reference) |
| Rural area | 1.31 (1.11, 1.54) | 1.20 (1.16, 1.24) |
1.17 (1.00, 1.37) | 1.00 (reference) |
| Occupational classification | ||||
| White-collar | 1.54 (1.24, 1.91) | 1.34 (1.24, 1.45) |
1.29 (1.05, 1.58) |
1.00 (reference) |
| Blue-collar | 1.25 (1.01, 1.55) | 1.07 (1.03, 1.12) |
0.86 (0.66, 1.12) | 1.00 (reference) |
| Pink-collar | 0.94 (0.65, 1.36) | 1.22 (1.11, 1.34) |
0.96 (0.69, 1.33) | 1.00 (reference) |
| None | 1.45 (1.03, 2.04) | 1.31 (1.25, 1.38) |
1.36 (1.00, 1.85) |
1.00 (reference) |
Table 1. General characteristics of the study population (n=460,603)
Values are presented as number (%).
Table 2. Factors associated with diabetes
Values are presented as adjusted odds ratio (95% confidence interval).
Table 3. Subgroup analysis of odds ratio for diabetes stratified by smoking behavior
Values are presented as adjusted odds ratio (95% confidence interval). p<0.05.

