
Articles
- Page Path
- HOME > Epidemiol Health > Volume 40; 2018 > Article
-
Original Article
Seasonality of tuberculosis in the Republic of Korea, 2006-2016 -
Eun Hee Kim
 , Jong-Myon Bae
 -
Epidemiol Health 2018;40:e2018051.
DOI: https://doi.org/10.4178/epih.e2018051
Published online: October 20, 2018
Department of Preventive Medicine, Jeju National University School of Medicine, Jeju, Korea
- Correspondence: Jong-Myon Bae Department of Preventive Medicine, Jeju National University School of Medicine, 102 Jejudaehak-ro, Jeju 63241, Korea E-mail: jmbae@jejunu.ac.kr
• Received: September 20, 2018 • Accepted: October 20, 2018
©2018, Korean Society of Epidemiology
This is an open-access article distributed under the terms of the Creative Commons Attribution License (http://creativecommons.org/licenses/by/4.0/), which permits unrestricted use, distribution, and reproduction in any medium, provided the original work is properly cited.


Figure & Data
References
Citations
Citations to this article as recorded by 
- Forecasting tuberculosis epidemics using an autoregressive fractionally integrated moving average model: a 17-year time series analysis
Yongbin Wang, Yifang Liang, Bingjie Zhang, Shibei Yi, Peiping Zhou, Xianxiang Lan, Chenlu Xue, Yanyan Li, Xinxiao Li, Chunjie Xu
Journal of Global Health.2025;[Epub] CrossRef - Spatial and temporal analysis and forecasting of TB reported incidence in western China
Daren Zhao, Huiwu Zhang, Xuelian Wu, Lan Zhang, Shiyuan Li, Sizhang He
BMC Public Health.2024;[Epub] CrossRef - Epidemiology-based wastewater monitoring for ecological risks of anti-tuberculosis drugs mixture effects
Wei-Yu Chen, Yi-Fang Chen, Jer-Min Tsai, Hsin-Mei Huang, Yong-Chao Su
Science of The Total Environment.2023; 892: 164560. CrossRef - An influence of dew point temperature on the occurrence of Mycobacterium tuberculosis disease in Chennai, India
Rajendran Krishnan, Kannan Thiruvengadam, Lavanya Jayabal, Sriram Selvaraju, Basilea Watson, Muniyandi Malaisamy, Karikalan Nagarajan, Srikanth P. Tripathy, Ponnuraja Chinnaiyan, Padmapriyadarsini Chandrasekaran
Scientific Reports.2022;[Epub] CrossRef - Novel mobility index tracks COVID-19 transmission following stay-at-home orders
Peter Hyunwuk Her, Sahar Saeed, Khai Hoan Tram, Sahir R Bhatnagar
Scientific Reports.2022;[Epub] CrossRef - Contributions of ambient temperature and relative humidity to the risk of tuberculosis admissions: A multicity study in Central China
Kai Huang, Cheng-Yang Hu, Xi-Yao Yang, Yunquan Zhang, Xin-Qiang Wang, Kang-Di Zhang, Ying-Qing Li, Jie Wang, Wen-Jie Yu, Xin Cheng, Ji-Yu Cao, Tao Zhang, Xiao-Hong Kan, Xiu-Jun Zhang
Science of The Total Environment.2022; 838: 156272. CrossRef -
Descriptive Data Analysis of Tuberculosis Surveillance Data, Sene East District, Ghana, 2020
Rapheal Gyan Asamoah, Delia Akosua Bandoh, Samuel Dapaa, Joseph Asamoah Frimpong, Ernest Kenu
Journal of Interventional Epidemiology and Public Health .2022;[Epub] CrossRef - Forecasting the Tuberculosis Incidence Using a Novel Ensemble Empirical Mode Decomposition-Based Data-Driven Hybrid Model in Tibet, China
Jizhen Li, Yuhong Li, Ming Ye, Sanqiao Yao, Chongchong Yu, Lei Wang, Weidong Wu, Yongbin Wang
Infection and Drug Resistance.2021; Volume 14: 1941. CrossRef - The Relationship Between Socio-Demographic Factors and Tuberculosis Mortality in the Republic of Korea During 2008–2017
SeoYeon Chung, Jeong-Yeon Seon, Seung Heon Lee, Hae-Young Kim, Yeo Wool Lee, Kyoungeun Bae, In-Hwan Oh
Frontiers in Public Health.2021;[Epub] CrossRef - Estimating the Effects of the COVID-19 Outbreak on the Reductions in Tuberculosis Cases and the Epidemiological Trends in China: A Causal Impact Analysis
Wenhao Ding, Yanyan Li, Yichun Bai, Yuhong Li, Lei Wang, Yongbin Wang
Infection and Drug Resistance.2021; Volume 14: 4641. CrossRef Secular Seasonality and Trend Forecasting of Tuberculosis Incidence Rate in China Using the Advanced Error-Trend-Seasonal Framework
Yongbin Wang, Chunjie Xu, Jingchao Ren, Weidong Wu, Xiangmei Zhao, Ling Chao, Wenjuan Liang, Sanqiao Yao
Infection and Drug Resistance.2020; Volume 13: 733. CrossRef- Notifiable Respiratory Infectious Diseases in China: A Spatial–Temporal Epidemiology Analysis
Ying Mao, Rongxin He, Bin Zhu, Jinlin Liu, Ning Zhang
International Journal of Environmental Research and Public Health.2020; 17(7): 2301. CrossRef - A study on the relationship between air pollution and pulmonary tuberculosis based on the general additive model in Wulumuqi, China
Jiandong Yang, Mengxi Zhang, Yanggui Chen, Li Ma, Rayibai Yadikaer, Yaoqin Lu, Pengwei Lou, Yujiao Pu, Ran Xiang, Baolin Rui
International Journal of Infectious Diseases.2020; 96: 42. CrossRef - Short-term effect of ambient temperature change on the risk of tuberculosis admissions: Assessments of two exposure metrics
Kai Huang, Xiao-Jing Yang, Cheng-Yang Hu, Kun Ding, Wen Jiang, Xiao-Guo Hua, Jie Liu, Ji-Yu Cao, Chen-Yu Sun, Tao Zhang, Xiao-Hong Kan, Xiu-Jun Zhang
Environmental Research.2020; 189: 109900. CrossRef - The characteristics of spatial-temporal distribution and cluster of tuberculosis in Yunnan Province, China, 2005–2018
Jinou Chen, Yubing Qiu, Rui Yang, Ling Li, Jinglong Hou, Kunyun Lu, Lin Xu
BMC Public Health.2019;[Epub] CrossRef
 PubReader
 ePub Link
 Cite
CiteSeasonality of tuberculosis in the Republic of Korea, 2006-2016
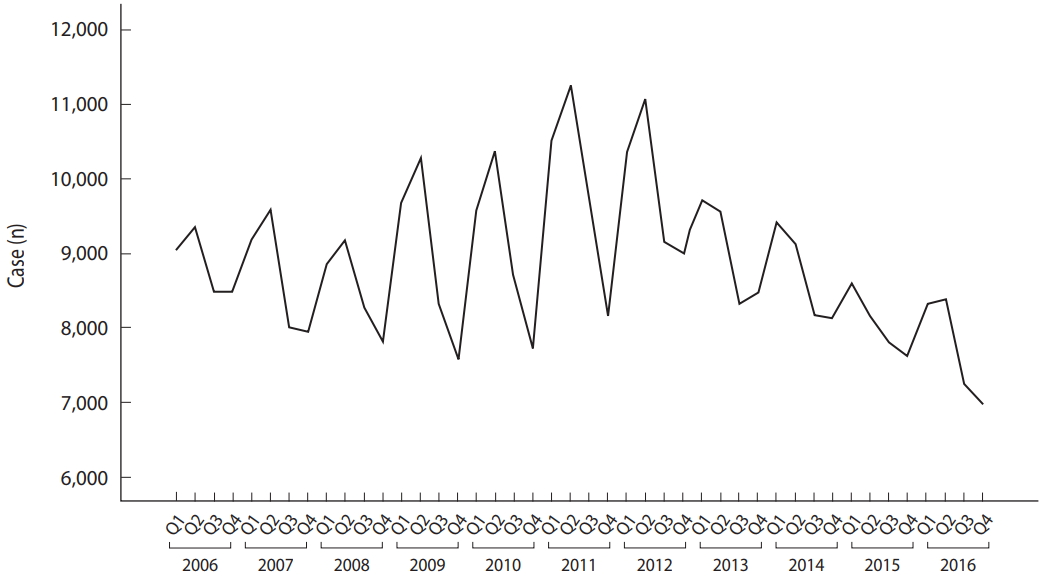
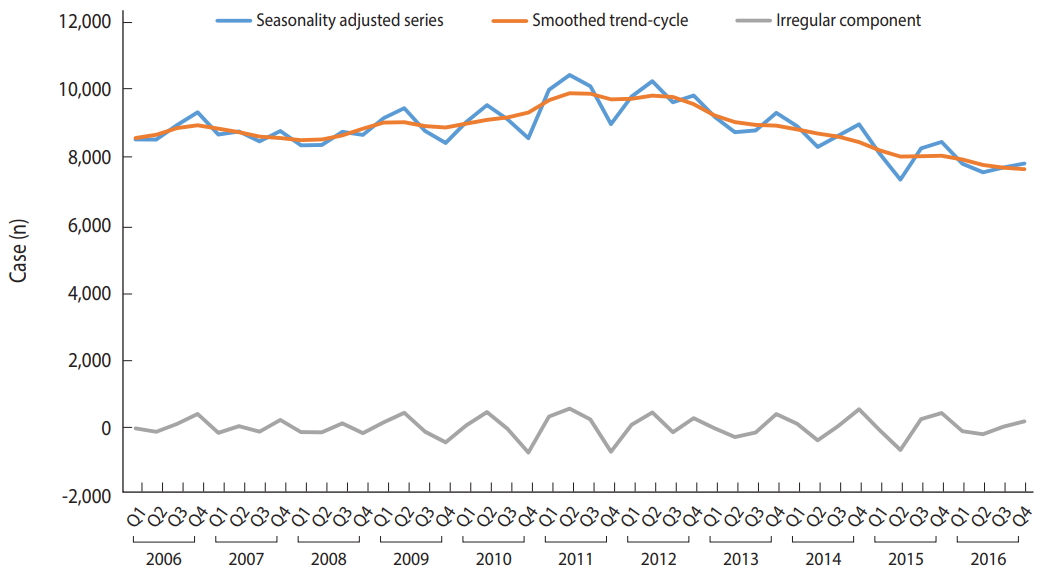
Figure 1. Seasonal notified tuberculosis cases, 2006-2016.
Figure 2. Time series decompositions of tuberculosis cases.
Figure 1.
Figure 2.
Seasonality of tuberculosis in the Republic of Korea, 2006-2016
| Areas | Country [reference] | Study period | Season (month) |
|
|---|---|---|---|---|
| Peak | Trough | |||
| Asia | Japan [5] | 1998, 2000-2003 | Spring-summer (May-Aug) | Fall-winter (Nov-Jan) |
| China [6] | 2005-2014 | Spring (Mar) | Fall (Oct) | |
| Hong Kong [7] | 1991-2002 | Summer (Jul and Aug) | Winter (Jan and Feb) | |
| India [8] | 1996-2001 | Spring (Apr-Jun) | Fall-winter (Oct-Dec) | |
| Pakistan [9] | 2006-2013 | Spring (Apr-Jun) | Fall-winter (Oct-Dec) | |
| Kuwait [10] | 1997-2006 | Spring-summer (Mar-Aug) | Fall-winter (Aug-Dec) | |
| Iran [11] | 2001-2011 | Spring (May) | Winter (Feb) | |
| Israel [12] | 2001-2011 | Spring | Fall | |
| Europe | Portugal [13] | 2000-2010 | Spring (Mar) | Winter (Dec) |
| Spain [14] | 1996-2004 | Summer | Fall-winter | |
| Netherlands [15] | 1993-2008 | Spring | Winter | |
| UK [16] | 1983-1992 | Summer | Winter | |
| Others | USA [17] | 1993-2008 | Spring (Mar) | Fall (Nov) |
| Australia [18] | 2002-2011 | Fall (Oct) | Summer (Jun) | |
| Cameroon [19] | 2002-2004 | Winter (rainy season) | Summer (dry season) | |
| Year | Spring | Summer | Fall | Winter |
|---|---|---|---|---|
| 2006 | 9,041 (18.5) | 9,344 (19.1) | 8,484 (17.4) | 8,492 (17.4) |
| 2007 | 9,186 (18.7) | 9,584 (19.5) | 8,005 (16.3) | 7,935 (16.2) |
| 2008 | 8,868 (17.9) | 9,184 (18.6) | 8,284 (16.8) | 7,821 (15.8) |
| 2009 | 9,675 (19.5) | 10,276 (20.7) | 8,313 (16.7) | 7,581 (15.3) |
| 2010 | 9,560 (19.2) | 10,367 (20.8) | 8,655 (17.4) | 7,723 (15.5) |
| 2011 | 10,516 (21.0) | 11,262 (22.5) | 9,639 (19.2) | 8,140 (16.2) |
| 2012 | 10,315 (20.5) | 11,077 (22.0) | 9,161 (18.2) | 8,992 (17.9) |
| 2013 | 9,724 (19.2) | 9,561 (18.9) | 8,327 (16.5) | 8,477 (16.8) |
| 2014 | 9,438 (18.6) | 9,124 (18.0) | 8,172 (16.1) | 8,135 (16.0) |
| 2015 | 8,619 (16.9) | 8,154 (16.0) | 7,794 (15.3) | 7,614 (14.9) |
| 2016 | 8,321 (16.3) | 8,371 (16.4) | 7,229 (14.1) | 6,971 (13.6) |
| Total | 103,263 | 106,304 | 92,063 | 87,881 |
| Month | Mean cases | Range |
CR | |
|---|---|---|---|---|
| Minimun | Maximum | |||
| Jan | 2,623 | 2,190 | 3,038 | 5.2 |
| Feb | 2,559 | 2,138 | 3,145 | 5.1 |
| Mar | 3,030 | 2,781 | 3,467 | 6.1 |
| Apr | 3,181 | 2,711 | 3,529 | 6.4 |
| May | 3,176 | 2,713 | 3,649 | 6.3 |
| Jun | 3,210 | 2,777 | 3,768 | 6.4 |
| Jul | 3,346 | 2,774 | 3,889 | 6.7 |
| Aug | 3,109 | 2,577 | 3,825 | 6.2 |
| Sep | 2,792 | 2,321 | 3,242 | 5.6 |
| Oct | 2,813 | 2,450 | 3,147 | 5.6 |
| Nov | 2,765 | 2,458 | 3,330 | 5.5 |
| Dec | 2,807 | 2,409 | 3,291 | 5.6 |
| Season | 2006-2016 | 2006-2012 | 2013-2016 |
|---|---|---|---|
| Spring | 508.140 | 532.164 | 469.568 |
| Summer | 813.315 | 1,108.955 | 318.068 |
| Fall | -474.069 | -507.491 | -440.703 |
| Winter | -847.385 | -1,133.628 | -346.932 |
Table 1. Summaries of the seasonality of tuberculosis by countries
Table 2. Seasonal number and crude rates of tuberculosis notifications, 2006-2016
Values are presented as number (crude rate). Unit: cases (per 100,000 population).
Table 3. Monthly mean number and crude rate (CR) of tuberculosis notifications, 2006-2016
Unit: cases (per 100,000 population).
Table 4. Seasonal indices by seasonal decomposition method for tuberculosis notifications in Korea

